
Articles
- Page Path
- HOME > Korean J Community Nutr > Volume 30(2); 2025 > Article
-
Research Article
- Healthy eating intentions among adults in China: a cross-sectional study of northern and southern regions and city tiers based on the theory of planned behavior
-
Yi Jiang1)
 , Ji-Yun Hwang2),†
 -
Korean Journal of Community Nutrition 2025;30(2):114-126.
DOI: https://doi.org/10.5720/kjcn.2025.00087
Published online: April 29, 2025
1)Graduate Student, Department of Foodservice Management and Nutrition, Graduate School, Sangmyung University, Seoul, Korea
2)Professor, Major of Foodservice Management and Nutrition, Sangmyung University, Seoul, Korea
- †Corresponding author: Ji-Yun Hwang Major of Foodservice Management and Nutrition, Graduate School, Sangmyung University, Seoul 03016, Korea Tel: +82-2-781-7521 Fax: +82-2-2287-0104 Email: jiyunhk@smu.ac.kr
• Received: March 20, 2025 • Revised: March 28, 2025 • Accepted: April 3, 2025
© 2025 The Korean Society of Community Nutrition
This is an Open-Access article distributed under the terms of the Creative Commons Attribution Non-Commercial License (http://creativecommons.org/licenses/by-nc/4.0) which permits unrestricted non-commercial use, distribution, and reproduction in any medium, provided the original work is properly cited.
- 1,272 Views
- 28 Download
- 1 Crossref
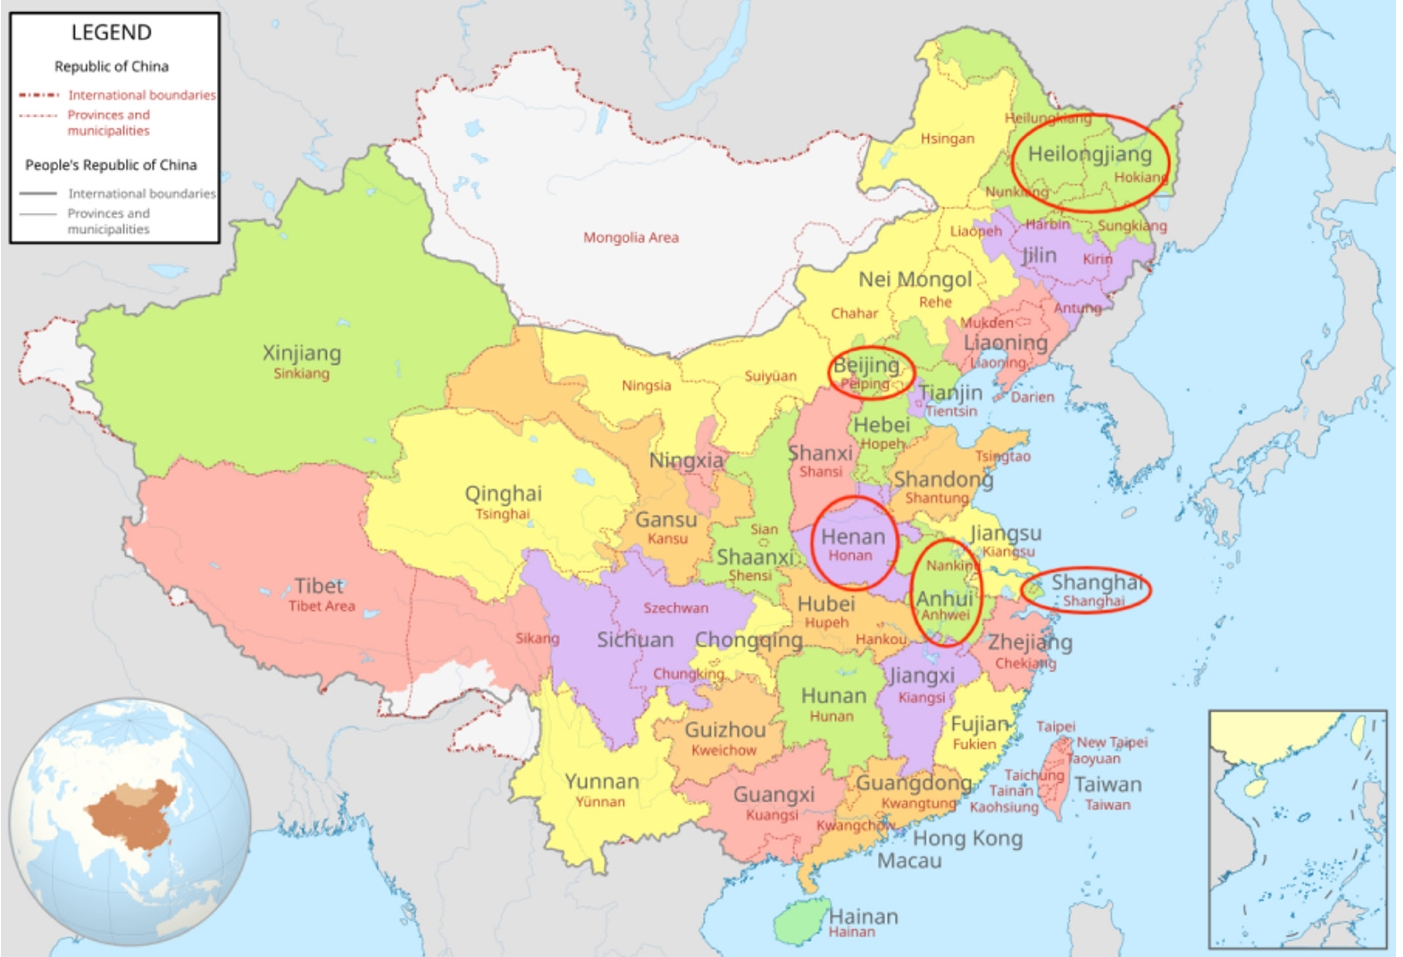
Figure & Data
REFERENCES
Citations
Citations to this article as recorded by 
- Beyond taste: Unpacking the drivers of plant-based diet adoption
Md. Asaduzzaman Babu
Food and Humanity.2025; 5: 100779. CrossRef
 Cite
CiteHealthy eating intentions among adults in China: a cross-sectional study of northern and southern regions and city tiers based on the theory of planned behavior

Fig. 1. Study locations in China. Modified from Wikipedia [Internet]. Wikipedia; 2009 [cited 2025 Mar 24] (https://upload.wikimedia.org/wikipedia/commons/thumb/9/98/ROC_vs_PRC.svg/1280px-ROC_vs_PRC.svg.png) [25].
Fig. 1.
Healthy eating intentions among adults in China: a cross-sectional study of northern and southern regions and city tiers based on the theory of planned behavior
| Contents | Total (n = 2,114) | Geographic region |
City-tier |
||||||
|---|---|---|---|---|---|---|---|---|---|
| North (n = 1,439) | South (n = 675) | χ2 |
P-values |
First-tier (n = 640) | Other cities (n = 1,474) | χ2 |
P-values |
||
| Sex | 24.18 | <0.001 | 4.07 | 0.044 | |||||
| Male | 912 (43.1) | 673 (46.8) | 239 (35.4) | 261 (40.8) | 651 (44.2) | ||||
| Female | 1,202 (56.9) | 766 (53.2) | 436 (64.6) | 379 (59.2) | 823 (55.8) | ||||
| Age (year) | 48.49 | <0.001 | 44.72 | <0.001 | |||||
| 18–25 | 716 (33.9) | 523 (36.3) | 193 (28.6) | 206 (32.2) | 510 (34.6) | ||||
| 26–39 | 724 (34.2) | 422 (29.3) | 302 (44.7) | 244 (38.1) | 480 (32.6) | ||||
| 40–64 | 674 (31.9) | 494 (34.3) | 180 (26.7) | 190 (29.7) | 484 (32.8) | ||||
| Marital status | 0.40 | 0.527 | 2.53 | 0.111 | |||||
| Married | 1,147 (54.3) | 774 (53.8) | 373 (55.3) | 336 (52.5) | 811 (55.0) | ||||
| Unmarried | 967 (45.7) | 665 (46.2) | 302 (44.7) | 304 (47.5) | 663 (45.0) | ||||
| Alcohol consumption | 22.80 | <0.001 | 48.14 | <0.001 | |||||
| Never | 861 (40.7) | 545 (37.9) | 316 (46.8) | 260 (40.1) | 601 (40.8) | ||||
| < Once per week | 642 (30.4) | 471 (32.7) | 171 (25.3) | 144 (22.5) | 498 (33.8) | ||||
| ≥ Once per week | 538 (25.4) | 364 (25.3) | 174 (25.8) | 219 (34.2) | 319 (21.6) | ||||
| Everyday | 73 (3.5) | 59 (4.1) | 14 (2.1) | 17 (2.7) | 56 (3.8) | ||||
| Lifetime smoking | 5.59 | 0.018 | 0.30 | 0.586 | |||||
| Never | 1,429 (67.6) | 949 (65.9) | 480 (71.1) | 438 (68.4) | 991 (67.2) | ||||
| Ever | 685 (32.4) | 490 (34.1) | 195 (28.9) | 202 (31.6) | 483 (32.8) | ||||
| Presence of disease | 1.45 | 0.229 | 11.28 | 0.001 | |||||
| Yes | 352 (16.7) | 230 (16.0) | 122 (18.1) | 126 (19.7) | 226 (15.3) | ||||
| No | 1,762 (83.3) | 1,209 (84.0) | 553 (81.9) | 514 (80.3) | 1,248 (84.7) | ||||
| Cohabitation with family | 0.01 | 0.938 | 33.67 | <0.001 | |||||
| Yes | 1,490 (70.5) | 1,015 (70.5) | 475 (70.4) | 492 (76.9) | 998 (67.7) | ||||
| No | 624 (29.5) | 424 (29.5) | 200 (29.6) | 148 (23.1) | 476 (32.3) | ||||
| Employment status | 3.04 | 0.081 | 30.77 | <0.001 | |||||
| Yes | 1,385 (65.5) | 925 (64.3) | 460 (68.1) | 475 (74.2) | 910 (61.7) | ||||
| No | 729 (34.5) | 514 (35.7) | 215 (31.9) | 165 (25.8) | 564 (38.3) | ||||
| Education level | 6.63 | 0.010 | 113.91 | <0.001 | |||||
| ≤ High school | 753 (35.7) | 539 (37.5) | 214 (31.7) | 120 (18.8) | 633 (42.9) | ||||
| ≥ College | 1,361 (64.3) | 900 (62.5) | 461 (68.3) | 520 (81.2) | 841 (57.1) | ||||
| Monthly income (CNY) | 10.26 | 0.001 | 17.07 | <0.001 | |||||
| ≤ 5,000 | 1,069 (50.6) | 762 (52.9) | 307 (45.5) | 280 (43.8) | 789 (53.5) | ||||
| > 5,000 | 1,045 (49.4) | 677 (47.1) | 368 (54.5) | 360 (56.2) | 685 (46.5) | ||||
| Physical activity | 5.27 | 0.072 | 138.66 | <0.001 | |||||
| Low | 712 (33.7) | 485 (33.7) | 227 (33.6) | 228 (35.6) | 484 (32.8) | ||||
| Moderate | 698 (33.0) | 495 (34.4) | 203 (30.1) | 107 (16.7) | 591 (40.1) | ||||
| Active | 704 (33.3) | 459 (31.9) | 245 (36.3) | 305 (47.7) | 399 (27.1) | ||||
| Attitude | t-value | P-value |
Subjective norms | t-value | P-value |
Perceived behavioral control | t-value | P-value |
Intention | t-value | P-value |
|
|---|---|---|---|---|---|---|---|---|---|---|---|---|
| Total | 4.04 ± 0.79 | 3.90 ± 0.80 | 3.82 ± 0.83 | 3.78 ± 0.88 | ||||||||
| Geographic region | –1.39 | 0.165 | 3.69 | <0.001 | 2.09 | 0.037 | 2.57 | 0.010 | ||||
| North | 4.03 ± 0.79 | 3.94 ± 0.79 | 3.85 ± 0.82 | 3.81 ± 0.87 | ||||||||
| South | 4.08 ± 0.80 | 3.80 ± 0.82 | 3.77 ± 0.83 | 3.71 ± 0.89 | ||||||||
| City-tier | –5.91 | < 0.001 | –5.16 | <0.001 | –4.90 | <0.001 | –4.76 | <0.001 | ||||
| First-tier | 3.84 ± 0.93 | 3.70 ± 0.91 | 3.63 ± 0.92 | 3.58 ± 0.97 | ||||||||
| Other cities | 4.13 ± 0.70 | 3.99 ± 0.73 | 3.91 ± 0.76 | 3.87 ± 0.83 | ||||||||
| City-tier and geographic region | ||||||||||||
| First-tier | –3.76 | < 0.001 | –0.90 | 0.371 | –2.22 | 0.027 | –2.12 | 0.034 | ||||
| North | 3.61 ± .1.00 | 3.59 ± 0.99 | 3.49 ± 0.98 | 3.42 ± 1.05 | ||||||||
| South | 3.98 ± 0.85 | 3.76 ± 0.85 | 3.72 ± 0.88 | 3.68 ± 0.91 | ||||||||
| Other cities | –3.79 | < 0.001 | 3.32 | 0.001 | 4.25 | <0.001 | 0.26 | 0.797 | ||||
| North | 4.11 ± 0.70 | 4.01 ± 0.72 | 3.92 ± 0.77 | 3.89 ± 0.81 | ||||||||
| South | 4.22 ± 0.69 | 3.86 ± 0.78 | 3.84 ± 0.75 | 3.74 ± 0.88 | ||||||||
| Between northern first-tier cities and other cities | –6.60 | < 0.001 | –5.28 | <0.001 | –5.73 | <0.001 | –5.65 | <0.001 | ||||
| Between southern first-tier cities and other cities | –1.71 | 0.088 | –0.48 | 0.633 | –0.03 | 0.974 | –0.31 | 0.754 |
| Factors |
Beta | SE | t | P-value |
||
|---|---|---|---|---|---|---|
| Independent variables | Dependent variables | |||||
| Geographic region north (ref = south) | Attitude | –0.03 | 0.37 | –1.39 | 0.165 | |
| Subjective norms | 0.08 | 0.04 | 3.74 | <0.001 | ||
| Perceived behavioral control | 0.05 | 0.04 | 2.09 | 0.037 | ||
| Intention | 0.06 | 0.04 | 2.57 | 0.010 | ||
| City tier other cities (ref = first-tier) | Attitude | 0.17 | 0.04 | 8.03 | <0.001 | |
| Subjective norms | 0.16 | 0.04 | 7.63 | <0.001 | ||
| Perceived behavioral control | 0.15 | 0.04 | 7.12 | <0.001 | ||
| Intention | 0.15 | 0.04 | 6.84 | <0.001 | ||
| City-tier by geographic region other cities (ref = first-tier) | North | Attitude | 0.20 | 0.05 | 7.64 | <0.001 |
| South | 0.07 | 0.06 | 1.71 | 0.088 | ||
| North | Subjective norms | 0.16 | 0.05 | 6.00 | <0.001 | |
| South | 0.02 | 0.06 | 0.48 | 0.633 | ||
| North | Perceived behavioral control | 0.16 | 0.05 | 6.27 | <0.001 | |
| South | 0.01 | 0.06 | 0.33 | 0.974 | ||
| North | Intention | 0.16 | 0.05 | 6.22 | <0.001 | |
| South | –0.01 | 0.07 | –0.31 | 0.754 | ||
| Geographic region and city-tier classification |
||||
|---|---|---|---|---|
| Theory of planned behavior constructs | First-tier cities in north (n=243) | Other cities in north (n=1,196) | First-tier cities in south (n=397) | Other cities in south (n=278) |
| Each construct as dependent variable | ||||
| Attitude | 1.00 | 3.57 |
2.08 |
6.06 |
| (2.62–4.86) | (1.48–2.92) | (3.94–9.31) | ||
| Subjective norms | 1.00 | 2.33 |
1.14 | 1.22 |
| (1.73–3.14) | (0.82–1.57) | (0.85–1.74) | ||
| Perceived behavioral control | 1.00 | 2.58 |
1.48 |
1.98 |
| (1.91–3.48) | (1.06–2.07) | (1.37–2.86) | ||
| Intention | 1.00 | 3.04 |
1.52 |
2.23 |
| (2.25–4.12) | (1.09–2.12) | (1.54–3.23) | ||
| Intention as a dependent variable including three constructs as independent variable | ||||
| Intention | 1.00 | 2.43 |
1.34 | 1.95 |
| (1.48–3.97) | (0.78–2.29) | (1.08–3.51) | ||
Table 1. General characteristics of participants by geographic region and city-tier classification
n (%). CNY, Chinese Yuan. chi-square test was used for comparison. The significance level for statistical analysis was
Table 2. Comparison of theory of planned behavior constructs by geographic region and city-tier classification
Mean ± SD. The significance level for statistical analysis was
Table 3. Linear regression results of the relationships among theory of planned behavior constructs by geographic region and city-tier classification
Adjusted for sex, age, alcohol consumption, lifetime smoking, presence of disease, living with family, employment status, education level, monthly income, and physical activity.
Table 4. Odds ratios (95% confidence intervals) for compliance with theory of planned behavior constructs by geographic region and city-tier classification (ref = first-tier in north)
Odds ratios or (95% confidence intervals). Adjusted for sex, age, alcohol consumption, lifetime smoking, presence of disease, living with family, employment status, education level, monthly income, and physical activity.


