
Articles
- Page Path
- HOME > Korean J Community Nutr > Volume 30(2); 2025 > Article
-
Research Article
- Healthy eating intentions among adults in China: a cross-sectional study of northern and southern regions and city tiers based on the theory of planned behavior
-
Yi Jiang1)
 , Ji-Yun Hwang2),†
 -
Korean Journal of Community Nutrition 2025;30(2):114-126.
DOI: https://doi.org/10.5720/kjcn.2025.00087
Published online: April 29, 2025
1)Graduate Student, Department of Foodservice Management and Nutrition, Graduate School, Sangmyung University, Seoul, Korea
2)Professor, Major of Foodservice Management and Nutrition, Sangmyung University, Seoul, Korea
- †Corresponding author: Ji-Yun Hwang Major of Foodservice Management and Nutrition, Graduate School, Sangmyung University, Seoul 03016, Korea Tel: +82-2-781-7521 Fax: +82-2-2287-0104 Email: jiyunhk@smu.ac.kr
• Received: March 20, 2025 • Revised: March 28, 2025 • Accepted: April 3, 2025
© 2025 The Korean Society of Community Nutrition
This is an Open-Access article distributed under the terms of the Creative Commons Attribution Non-Commercial License (http://creativecommons.org/licenses/by-nc/4.0) which permits unrestricted non-commercial use, distribution, and reproduction in any medium, provided the original work is properly cited.
- 1,269 Views
- 28 Download
- 1 Crossref
Abstract
-
Objectives
- The theory of planned behavior (TPB) has been widely employed to predict healthy eating intentions. Regional differences may affect dietary habits, health status, and personality traits, whereas variations in urbanization influence accessibility to fresh and healthy food, thereby impacting TPB components. This study aimed to explore whether regional differences between northern and southern China including city-tier development are associated with healthy eating intentions among Chinese adults.
-
Methods
- The study included data from 2,114 Chinese adults aged 19–64 years collected between 2019 and 2023. Participants were categorized by geographic region (north or south) and city-tier status (first-tier or other).
-
Results
- Compared to individuals from northern first-tier cities, those from southern regions exhibited stronger attitudes, perceived behavioral control (PBC), and intention to eat healthily. Participants from other cities in the north had more positive attitudes, subjective norms, PBC, and intentions to participate in healthy eating. Furthermore, residents of southern cities revealed weaker subjective norms than those of cities in the north. The adjusted odds ratio (OR) for compliance with intention to engage in healthy eating was higher among participants from other cities in both the north and south compared to those from northern first-tier cities (northern other cities: OR = 2.43, 95% confidence interval [CI]: 1.49–3.97, P < 0.001; southern other cities: OR = 1.95, 95% CI: 1.08–3.51, P = 0.027). No significant differences existed among the subjects from first-tier cities according to their geographic regions. These trends remained consistent even after including the interaction term between geographic regions and city-tier classification.
-
Conclusion
- These findings underscore the complexity of regional variations influencing dietary intentions and indicate that tailored health promotion strategies should incorporate regional characteristics. Future research should explore underlying factors, including regional cultural influences, to better inform policies and interventions.
INTRODUCTION
METHODS
1) General characteristics
2) TPB constructs
RESULTS
DISCUSSION
-
CONFLICT OF INTEREST
There are no financial or other issues that might lead to conflict of interest.
-
FUNDING
This research was funded by National Research Foundation of Korea grants from the Korean government (MSIT) (NRF-2020R1A2C1011675 and RS-2023-00280503).
-
DATA AVAILABILITY
Research data is available from the corresponding author upon request.
NOTES
Fig. 1.Study locations in China. Modified from Wikipedia [Internet]. Wikipedia; 2009 [cited 2025 Mar 24] (https://upload.wikimedia.org/wikipedia/commons/thumb/9/98/ROC_vs_PRC.svg/1280px-ROC_vs_PRC.svg.png) [25].
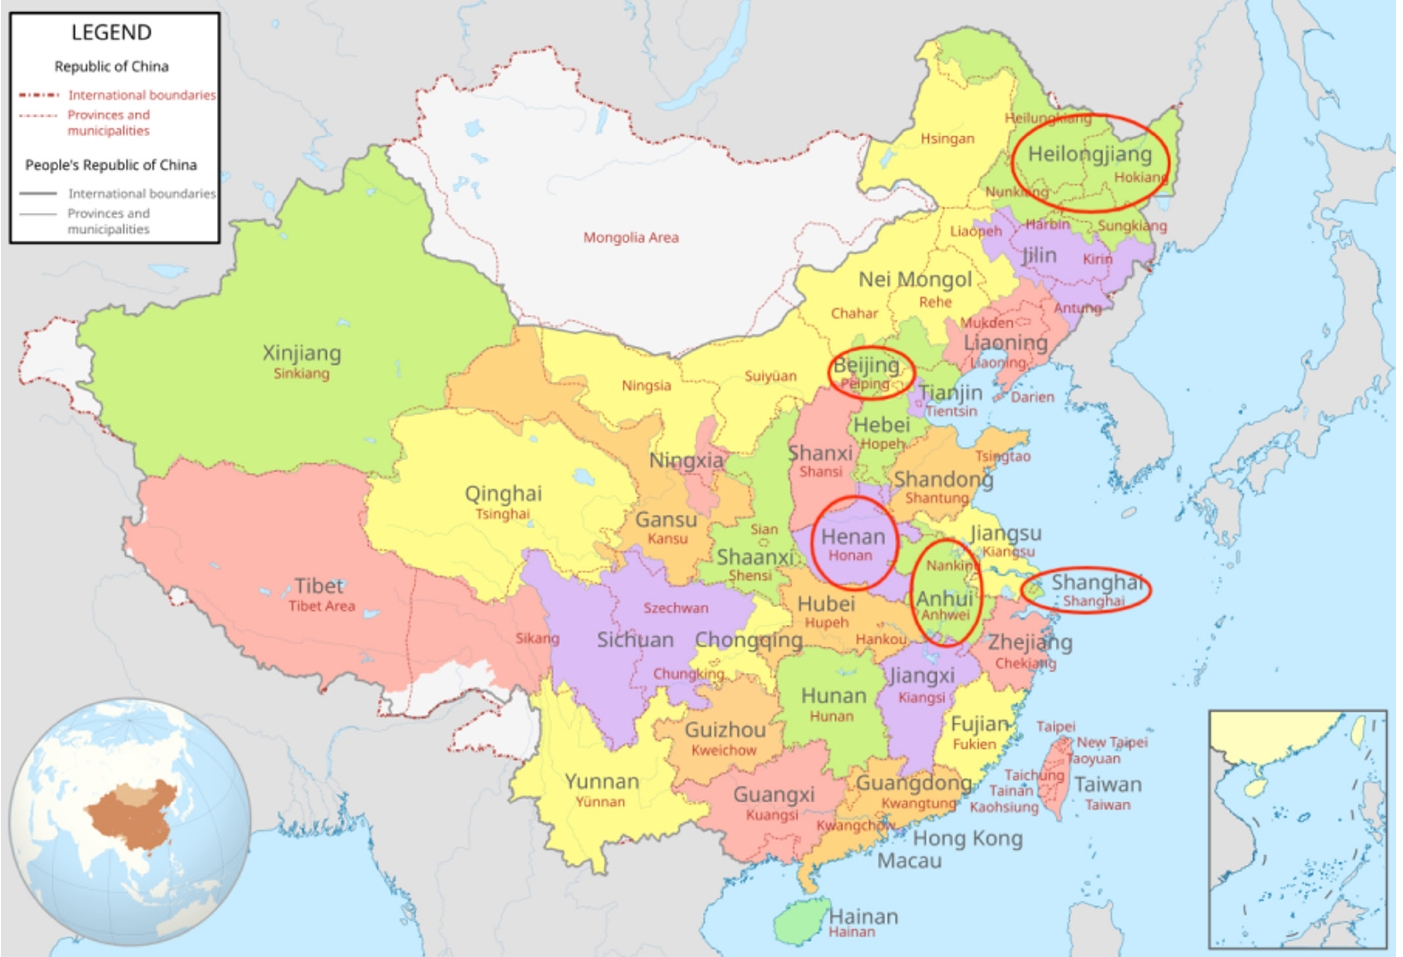
Table 1.General characteristics of participants by geographic region and city-tier classification
| Contents | Total (n = 2,114) |
Geographic region |
City-tier |
||||||
|---|---|---|---|---|---|---|---|---|---|
| North (n = 1,439) | South (n = 675) | χ2 1) | P-values2) | First-tier (n = 640) | Other cities (n = 1,474) | χ2 1) | P-values2) | ||
| Sex | 24.18 | <0.001 | 4.07 | 0.044 | |||||
| Male | 912 (43.1) | 673 (46.8) | 239 (35.4) | 261 (40.8) | 651 (44.2) | ||||
| Female | 1,202 (56.9) | 766 (53.2) | 436 (64.6) | 379 (59.2) | 823 (55.8) | ||||
| Age (year) | 48.49 | <0.001 | 44.72 | <0.001 | |||||
| 18–25 | 716 (33.9) | 523 (36.3) | 193 (28.6) | 206 (32.2) | 510 (34.6) | ||||
| 26–39 | 724 (34.2) | 422 (29.3) | 302 (44.7) | 244 (38.1) | 480 (32.6) | ||||
| 40–64 | 674 (31.9) | 494 (34.3) | 180 (26.7) | 190 (29.7) | 484 (32.8) | ||||
| Marital status | 0.40 | 0.527 | 2.53 | 0.111 | |||||
| Married | 1,147 (54.3) | 774 (53.8) | 373 (55.3) | 336 (52.5) | 811 (55.0) | ||||
| Unmarried | 967 (45.7) | 665 (46.2) | 302 (44.7) | 304 (47.5) | 663 (45.0) | ||||
| Alcohol consumption | 22.80 | <0.001 | 48.14 | <0.001 | |||||
| Never | 861 (40.7) | 545 (37.9) | 316 (46.8) | 260 (40.1) | 601 (40.8) | ||||
| < Once per week | 642 (30.4) | 471 (32.7) | 171 (25.3) | 144 (22.5) | 498 (33.8) | ||||
| ≥ Once per week | 538 (25.4) | 364 (25.3) | 174 (25.8) | 219 (34.2) | 319 (21.6) | ||||
| Everyday | 73 (3.5) | 59 (4.1) | 14 (2.1) | 17 (2.7) | 56 (3.8) | ||||
| Lifetime smoking | 5.59 | 0.018 | 0.30 | 0.586 | |||||
| Never | 1,429 (67.6) | 949 (65.9) | 480 (71.1) | 438 (68.4) | 991 (67.2) | ||||
| Ever | 685 (32.4) | 490 (34.1) | 195 (28.9) | 202 (31.6) | 483 (32.8) | ||||
| Presence of disease | 1.45 | 0.229 | 11.28 | 0.001 | |||||
| Yes | 352 (16.7) | 230 (16.0) | 122 (18.1) | 126 (19.7) | 226 (15.3) | ||||
| No | 1,762 (83.3) | 1,209 (84.0) | 553 (81.9) | 514 (80.3) | 1,248 (84.7) | ||||
| Cohabitation with family | 0.01 | 0.938 | 33.67 | <0.001 | |||||
| Yes | 1,490 (70.5) | 1,015 (70.5) | 475 (70.4) | 492 (76.9) | 998 (67.7) | ||||
| No | 624 (29.5) | 424 (29.5) | 200 (29.6) | 148 (23.1) | 476 (32.3) | ||||
| Employment status | 3.04 | 0.081 | 30.77 | <0.001 | |||||
| Yes | 1,385 (65.5) | 925 (64.3) | 460 (68.1) | 475 (74.2) | 910 (61.7) | ||||
| No | 729 (34.5) | 514 (35.7) | 215 (31.9) | 165 (25.8) | 564 (38.3) | ||||
| Education level | 6.63 | 0.010 | 113.91 | <0.001 | |||||
| ≤ High school | 753 (35.7) | 539 (37.5) | 214 (31.7) | 120 (18.8) | 633 (42.9) | ||||
| ≥ College | 1,361 (64.3) | 900 (62.5) | 461 (68.3) | 520 (81.2) | 841 (57.1) | ||||
| Monthly income (CNY) | 10.26 | 0.001 | 17.07 | <0.001 | |||||
| ≤ 5,000 | 1,069 (50.6) | 762 (52.9) | 307 (45.5) | 280 (43.8) | 789 (53.5) | ||||
| > 5,000 | 1,045 (49.4) | 677 (47.1) | 368 (54.5) | 360 (56.2) | 685 (46.5) | ||||
| Physical activity | 5.27 | 0.072 | 138.66 | <0.001 | |||||
| Low | 712 (33.7) | 485 (33.7) | 227 (33.6) | 228 (35.6) | 484 (32.8) | ||||
| Moderate | 698 (33.0) | 495 (34.4) | 203 (30.1) | 107 (16.7) | 591 (40.1) | ||||
| Active | 704 (33.3) | 459 (31.9) | 245 (36.3) | 305 (47.7) | 399 (27.1) | ||||
Table 2.Comparison of theory of planned behavior constructs by geographic region and city-tier classification
| Attitude | t-value | P-value1) | Subjective norms | t-value | P-value1) | Perceived behavioral control | t-value | P-value1) | Intention | t-value | P-value1) | |
|---|---|---|---|---|---|---|---|---|---|---|---|---|
| Total | 4.04 ± 0.79 | 3.90 ± 0.80 | 3.82 ± 0.83 | 3.78 ± 0.88 | ||||||||
| Geographic region | –1.39 | 0.165 | 3.69 | <0.001 | 2.09 | 0.037 | 2.57 | 0.010 | ||||
| North | 4.03 ± 0.79 | 3.94 ± 0.79 | 3.85 ± 0.82 | 3.81 ± 0.87 | ||||||||
| South | 4.08 ± 0.80 | 3.80 ± 0.82 | 3.77 ± 0.83 | 3.71 ± 0.89 | ||||||||
| City-tier | –5.91 | < 0.001 | –5.16 | <0.001 | –4.90 | <0.001 | –4.76 | <0.001 | ||||
| First-tier | 3.84 ± 0.93 | 3.70 ± 0.91 | 3.63 ± 0.92 | 3.58 ± 0.97 | ||||||||
| Other cities | 4.13 ± 0.70 | 3.99 ± 0.73 | 3.91 ± 0.76 | 3.87 ± 0.83 | ||||||||
| City-tier and geographic region | ||||||||||||
| First-tier | –3.76 | < 0.001 | –0.90 | 0.371 | –2.22 | 0.027 | –2.12 | 0.034 | ||||
| North | 3.61 ± .1.00 | 3.59 ± 0.99 | 3.49 ± 0.98 | 3.42 ± 1.05 | ||||||||
| South | 3.98 ± 0.85 | 3.76 ± 0.85 | 3.72 ± 0.88 | 3.68 ± 0.91 | ||||||||
| Other cities | –3.79 | < 0.001 | 3.32 | 0.001 | 4.25 | <0.001 | 0.26 | 0.797 | ||||
| North | 4.11 ± 0.70 | 4.01 ± 0.72 | 3.92 ± 0.77 | 3.89 ± 0.81 | ||||||||
| South | 4.22 ± 0.69 | 3.86 ± 0.78 | 3.84 ± 0.75 | 3.74 ± 0.88 | ||||||||
| Between northern first-tier cities and other cities | –6.60 | < 0.001 | –5.28 | <0.001 | –5.73 | <0.001 | –5.65 | <0.001 | ||||
| Between southern first-tier cities and other cities | –1.71 | 0.088 | –0.48 | 0.633 | –0.03 | 0.974 | –0.31 | 0.754 |
Table 3.Linear regression results of the relationships among theory of planned behavior constructs by geographic region and city-tier classification
|
Factors |
Beta | SE | t | P-value1) | ||
|---|---|---|---|---|---|---|
| Independent variables | Dependent variables | |||||
| Geographic region north (ref = south) | Attitude | –0.03 | 0.37 | –1.39 | 0.165 | |
| Subjective norms | 0.08 | 0.04 | 3.74 | <0.001 | ||
| Perceived behavioral control | 0.05 | 0.04 | 2.09 | 0.037 | ||
| Intention | 0.06 | 0.04 | 2.57 | 0.010 | ||
| City tier other cities (ref = first-tier) | Attitude | 0.17 | 0.04 | 8.03 | <0.001 | |
| Subjective norms | 0.16 | 0.04 | 7.63 | <0.001 | ||
| Perceived behavioral control | 0.15 | 0.04 | 7.12 | <0.001 | ||
| Intention | 0.15 | 0.04 | 6.84 | <0.001 | ||
| City-tier by geographic region other cities (ref = first-tier) | North | Attitude | 0.20 | 0.05 | 7.64 | <0.001 |
| South | 0.07 | 0.06 | 1.71 | 0.088 | ||
| North | Subjective norms | 0.16 | 0.05 | 6.00 | <0.001 | |
| South | 0.02 | 0.06 | 0.48 | 0.633 | ||
| North | Perceived behavioral control | 0.16 | 0.05 | 6.27 | <0.001 | |
| South | 0.01 | 0.06 | 0.33 | 0.974 | ||
| North | Intention | 0.16 | 0.05 | 6.22 | <0.001 | |
| South | –0.01 | 0.07 | –0.31 | 0.754 | ||
Table 4.Odds ratios (95% confidence intervals) for compliance with theory of planned behavior constructs by geographic region and city-tier classification (ref = first-tier in north)
|
Geographic region and city-tier classification |
||||
|---|---|---|---|---|
| Theory of planned behavior constructs | First-tier cities in north (n=243) | Other cities in north (n=1,196) | First-tier cities in south (n=397) | Other cities in south (n=278) |
| Each construct as dependent variable | ||||
| Attitude | 1.00 | 3.57***1) | 2.08*** | 6.06*** |
| (2.62–4.86) | (1.48–2.92) | (3.94–9.31) | ||
| Subjective norms | 1.00 | 2.33*** | 1.14 | 1.22 |
| (1.73–3.14) | (0.82–1.57) | (0.85–1.74) | ||
| Perceived behavioral control | 1.00 | 2.58*** | 1.48* | 1.98*** |
| (1.91–3.48) | (1.06–2.07) | (1.37–2.86) | ||
| Intention | 1.00 | 3.04*** | 1.52* | 2.23*** |
| (2.25–4.12) | (1.09–2.12) | (1.54–3.23) | ||
| Intention as a dependent variable including three constructs as independent variable | ||||
| Intention | 1.00 | 2.43*** | 1.34 | 1.95* |
| (1.48–3.97) | (0.78–2.29) | (1.08–3.51) | ||
Odds ratios or (95% confidence intervals).
Adjusted for sex, age, alcohol consumption, lifetime smoking, presence of disease, living with family, employment status, education level, monthly income, and physical activity.
1)P-value was determined by Binary logistics regression analysis results.
*P < 0.05,
***P < 0.001.
- 1. Ajzen I. The theory of planned behavior. Organ Behav Human Decis Process 1991; 50(2): 179-211. Article
- 2. Fila SA, Smith C. Applying the Theory of Planned Behavior to healthy eating behaviors in urban Native American youth. Int J Behav Nutr Phys Act 2006; 3: 11.ArticlePubMedPMCPDF
- 3. Jun J, Arendt SW. Understanding healthy eating behaviors at casual dining restaurants using the extended theory of planned behavior. Int J Hosp Manag 2016; 53: 106-115. Article
- 4. Cheng OY, Yam CLY, Cheung NS, Lee PLP, Ngai MC, Lin CY. Extended theory of planned behavior on eating and physical activity. Am J Health Behav 2019; 43(3): 569-581. ArticlePubMed
- 5. Watanabe T, Berry TR, Willows ND, Bell RC. Assessing intentions to eat low-glycemic index foods by adults with diabetes using a new questionnaire based on the theory of planned behaviour. Can J Diabetes 2015; 39(2): 94-100. ArticlePubMed
- 6. Blue CL. Does the theory of planned behavior identify diabetes-related cognitions for intention to be physically active and eat a healthy diet? Public Health Nurs 2007; 24(2): 141-150. ArticlePubMed
- 7. Conner M, Norman P, Bell R. The theory of planned behavior and healthy eating. Health Psychol 2002; 21(2): 194-201. ArticlePubMed
- 8. Brug J. Determinants of healthy eating: motivation, abilities and environmental opportunities. Fam Pract 2008; 25 Suppl 1: i50-i55. ArticlePubMed
- 9. Liu D, Lee S, Hwang JY. Factors related to the intention of healthy eating behaviors based on the theory of planned behavior: focused on adults residing in Beijing, China. J Nutr Health 2021; 54(1): 67-75. ArticlePDF
- 10. Liu A, Lee S, Hwang JY. Factors related to the short-term and long-term intentions of healthy eating among Chinese adults living in Shanghai and parts of Anhui Province of China using the theory of planned behavior. J Nutr Health 2022; 55(1): 188-199. ArticlePDF
- 11. Ma X, Lee S, Hwang JY. Healthy eating-out options are related to healthy eating intention in adults residing in Daqing (China). J Nutr Health 2023; 56(1): 112-121. ArticlePDF
- 12. Qi X, Ploeger A. Explaining consumers’ intentions towards purchasing green food in Qingdao, China: the amendment and extension of the theory of planned behavior. Appetite 2019; 133: 414-422. ArticlePubMed
- 13. Lili D, Ying Y, Qiuhui H, Mengxi L. Residents’ acceptance of using desalinated water in China based on the theory of planned behaviour (TPB). Mar Policy 2021; 123: 104293.Article
- 14. Lou S, Zhang X, Zhang D. What influences urban residents’ intention to sort waste?: Introducing Taoist cultural values into TPB. J Clean Prod 2022; 371: 133540.Article
- 15. Ma P. The influence of geographical environment upon dietetic culture differences between the North and the South in China: a case study of Guanzhong of Shanxi and Southeast of Guizhou. J Southeast Guizhou Natl Teach Coll 2010; 1: 128-132.
- 16. Liu Y, Gao X, Zhang Y, Zeng M, Liu Y, Wu Y, et al. Geographical variation in dementia prevalence across China: a geospatial analysis. Lancet Reg Health West Pac 2024; 47: 101117.ArticlePubMedPMC
- 17. Huang H, Zhang W, Tang C, Guo X, Zhao J. The impact of dietary culture differences between the north and south on physical condition and personality. Bus Manag. 2016 1: 347-348
- 18. Shimazaki T, Bao H, Deli G, Uechi H, Lee YH, Miura K, et al. Cross-cultural validity of the theory of planned behavior for predicting healthy food choice in secondary school students of Inner Mongolia. Diabetes Metab Syndr 2017; 11 Suppl 1: S497-S501. ArticlePubMed
- 19. Jin HJ, Moon S, Cho SM. Effects of access to food retailers and convenience of public transportation on residents’ fresh food intake and body mass index. J Transp Health 2022; 26: 101408.Article
- 20. Tan X, Zhang Y, Shao H. Healthy China 2030, a breakthrough for improving health. Glob Health Promot 2019; 26(4): 96-99. ArticlePubMedPDF
- 21. Anderson EN. The food of China. Yale University Press; 1988.
- 22. Qi W, Liu SH, Jin H. Applicability of the new standard of city-size classification in China. Prog Geogr 2016; 35(1): 47-56.
- 23. Song F, Cho MS. Geography of food consumption patterns between South and North China. Foods 2017; 6(5): 34.ArticlePubMedPMC
- 24. Zhu J, Xu Y, Fang Z, Shaw SL, Liu X. Geographic prevalence and mix of regional cuisines in Chinese cities. ISPRS Int J Geo-Inf 2018; 7: 183.Article
- 25. Wikipedia. Map of China in English [Internet]. Wikipedia; 2009 [cited 2025 Mar 24]. Available from: https://upload.wikimedia.org/wikipedia/commons/thumb/9/98/ROC_vs_PRC.svg/1280px-ROC_vs_PRC.svg.png
- 26. Baidu Encyclopedia. Henan province [Internet]. Baidu; n.d. [cited 2025 Mar 26]. Available from: https://baike.baidu.com/item/%E6%B2%B3%E5%8D%97%E7%9C%81/59474
- 27. Baidu Encyclopedia. Anhui province [Internet]. Baidu; n.d. [cited 2025 Mar 26]. Available from: https://baike.baidu.com/item/%E5%AE%89%E5%BE%BD%E7%9C%81/526353
- 28. Baidu Encyclopedia. Shanghai city [Internet]. Baidu; n.d. [cited 2025 Mar 26]. Available from: https://baike.baidu.com/item/%E4%B8%8A%E6%B5%B7%E5%B8%82/127743
- 29. Baidu Encyclopedia. Beijing city [Internet]. Baidu; n.d. [cited 2025 Mar 26]. Available from: https://baike.baidu.com/item/%E5%8C%97%E4%BA%AC%E5%B8%82/126069
- 30. Baidu Encyclopedia. Heilongjiang province [Internet]. Baidu; n.d. [cited 2025 Mar 26]. Available from: https://baike.baidu.com/item/%E9%BB%91%E9%BE%99%E6%B1%9F%E7%9C%81/129397?fromtitle=%E9%BB%91%E9%BE%99%E6%B1%9F&fromid=7351
- 31. Manstein SM, Shiah E, Laikhter E. Chapter 45 - Surveys and questionnaires: design, measures, and classic examples. In: Eltorai AEM, Bakal JA, Newell PC, Osband AJ, editors. Translational surgery: a volume in handbook for designing and conducting clinical and translational research. Academic Press; 2023. p. 273-280.
- 32. Harms C, Jackel L, Montag C. Reliability and completion speed in online questionnaires under consideration of personality. Personal Individ Differ 2017; 111: 281-290. Article
- 33. Malek L, Umberger WJ, Makrides M, ShaoJia Z. Predicting healthy eating intention and adherence to dietary recommendations during pregnancy in Australia using the Theory of Planned Behaviour. Appetite 2017; 116: 431-441. ArticlePubMed
- 34. Psouni S, Hassandra M, Theodorakis Y. Exercise and healthy eating intentions and behaviors among normal weight and overweight/obese adults. Psychology 2016; 7: 598-611. ArticlePDF
- 35. Ma G. Food, eating behavior, and culture in Chinese society. J Ethnic Foods 2015; 2(4): 195-199. Article
- 36. Ma X, Lee S, Hwang JY. Motivations for healthy eating decreased after the COVID-19 pandemic in the Daqing area of China. J Korean Soc Food Cult 2024; 39(2): 106-118.
- 37. Cheng J. Progress of tertiary oil recovery technology and future research direction in Daqing oilfield during the tenth five year plan period. Daqing Petroleum Geol Dev 2006; 1: 18-22.
- 38. Gao J, Keenan OE, Johnson AS, Wilhelm CA, Paul R, Racine EF. The COVID-19 pandemic, rising inflation, and their influence on dining out frequency and spending. Nutrients 2023; 15(6): 1373.ArticlePubMedPMC
- 39. Gupta AS, Mukherjee J. Long-term changes in consumers’ shopping behavior post-pandemic: an exploratory study. Int J Retail Distrib Manag 2022; 50(12): 1518-1534. Article
- 40. Chang X, DeFries RS, Liu L, Davis K. Understanding dietary and staple food transitions in China from multiple scales. PLoS One 2018; 13(4): e0195775. ArticlePubMedPMC
- 41. Traill WB, Chambers SA, Butler L. Attitudinal and demographic determinants of diet quality and implications for policy targeting. J Hum Nutr Diet 2012; 25(1): 87-94. ArticlePubMed
- 42. Grønhøj A, Bech‐Larsen T, Chan K, Tsang L. Using theory of planned behavior to predict healthy eating among Danish adolescents. Health Educ 2013; 113(1): 4-17. Article
- 43. Capacci S, Mazzocchi M, Shankar B, Macias JB, Verbeke W, Pérez-Cueto FJ, et al. Policies to promote healthy eating in Europe: a structured review of policies and their effectiveness. Nutr Rev 2012; 70(3): 188-200. ArticlePubMed
- 44. Talhelm T. The rice theory of culture. Online Read Psychol Cult 2022; 4(1): 7.Article
- 45. Yang M, Ju D, Tu K. “North-south gap”: facts, causes and challenges of China’s regional development pattern evolution. Econ Theory Bus Manag 2021; 41(4): 97.
- 46. Tan M. Yangzhou food culture and Huaiyang cuisine. China Today 1993; 2: 56-58.
- 47. Wang G. "Ele.me" interactive marketing: how to capture consumers’ stomachs? China Advert 2014; 10: 131-132.
REFERENCES
Figure & Data
REFERENCES
Citations
Citations to this article as recorded by 
- Beyond taste: Unpacking the drivers of plant-based diet adoption
Md. Asaduzzaman Babu
Food and Humanity.2025; 5: 100779. CrossRef
 Cite
CiteHealthy eating intentions among adults in China: a cross-sectional study of northern and southern regions and city tiers based on the theory of planned behavior

Fig. 1. Study locations in China. Modified from Wikipedia [Internet]. Wikipedia; 2009 [cited 2025 Mar 24] (https://upload.wikimedia.org/wikipedia/commons/thumb/9/98/ROC_vs_PRC.svg/1280px-ROC_vs_PRC.svg.png) [25].
Fig. 1.
Healthy eating intentions among adults in China: a cross-sectional study of northern and southern regions and city tiers based on the theory of planned behavior
| Contents | Total (n = 2,114) | Geographic region |
City-tier |
||||||
|---|---|---|---|---|---|---|---|---|---|
| North (n = 1,439) | South (n = 675) | χ2 |
P-values |
First-tier (n = 640) | Other cities (n = 1,474) | χ2 |
P-values |
||
| Sex | 24.18 | <0.001 | 4.07 | 0.044 | |||||
| Male | 912 (43.1) | 673 (46.8) | 239 (35.4) | 261 (40.8) | 651 (44.2) | ||||
| Female | 1,202 (56.9) | 766 (53.2) | 436 (64.6) | 379 (59.2) | 823 (55.8) | ||||
| Age (year) | 48.49 | <0.001 | 44.72 | <0.001 | |||||
| 18–25 | 716 (33.9) | 523 (36.3) | 193 (28.6) | 206 (32.2) | 510 (34.6) | ||||
| 26–39 | 724 (34.2) | 422 (29.3) | 302 (44.7) | 244 (38.1) | 480 (32.6) | ||||
| 40–64 | 674 (31.9) | 494 (34.3) | 180 (26.7) | 190 (29.7) | 484 (32.8) | ||||
| Marital status | 0.40 | 0.527 | 2.53 | 0.111 | |||||
| Married | 1,147 (54.3) | 774 (53.8) | 373 (55.3) | 336 (52.5) | 811 (55.0) | ||||
| Unmarried | 967 (45.7) | 665 (46.2) | 302 (44.7) | 304 (47.5) | 663 (45.0) | ||||
| Alcohol consumption | 22.80 | <0.001 | 48.14 | <0.001 | |||||
| Never | 861 (40.7) | 545 (37.9) | 316 (46.8) | 260 (40.1) | 601 (40.8) | ||||
| < Once per week | 642 (30.4) | 471 (32.7) | 171 (25.3) | 144 (22.5) | 498 (33.8) | ||||
| ≥ Once per week | 538 (25.4) | 364 (25.3) | 174 (25.8) | 219 (34.2) | 319 (21.6) | ||||
| Everyday | 73 (3.5) | 59 (4.1) | 14 (2.1) | 17 (2.7) | 56 (3.8) | ||||
| Lifetime smoking | 5.59 | 0.018 | 0.30 | 0.586 | |||||
| Never | 1,429 (67.6) | 949 (65.9) | 480 (71.1) | 438 (68.4) | 991 (67.2) | ||||
| Ever | 685 (32.4) | 490 (34.1) | 195 (28.9) | 202 (31.6) | 483 (32.8) | ||||
| Presence of disease | 1.45 | 0.229 | 11.28 | 0.001 | |||||
| Yes | 352 (16.7) | 230 (16.0) | 122 (18.1) | 126 (19.7) | 226 (15.3) | ||||
| No | 1,762 (83.3) | 1,209 (84.0) | 553 (81.9) | 514 (80.3) | 1,248 (84.7) | ||||
| Cohabitation with family | 0.01 | 0.938 | 33.67 | <0.001 | |||||
| Yes | 1,490 (70.5) | 1,015 (70.5) | 475 (70.4) | 492 (76.9) | 998 (67.7) | ||||
| No | 624 (29.5) | 424 (29.5) | 200 (29.6) | 148 (23.1) | 476 (32.3) | ||||
| Employment status | 3.04 | 0.081 | 30.77 | <0.001 | |||||
| Yes | 1,385 (65.5) | 925 (64.3) | 460 (68.1) | 475 (74.2) | 910 (61.7) | ||||
| No | 729 (34.5) | 514 (35.7) | 215 (31.9) | 165 (25.8) | 564 (38.3) | ||||
| Education level | 6.63 | 0.010 | 113.91 | <0.001 | |||||
| ≤ High school | 753 (35.7) | 539 (37.5) | 214 (31.7) | 120 (18.8) | 633 (42.9) | ||||
| ≥ College | 1,361 (64.3) | 900 (62.5) | 461 (68.3) | 520 (81.2) | 841 (57.1) | ||||
| Monthly income (CNY) | 10.26 | 0.001 | 17.07 | <0.001 | |||||
| ≤ 5,000 | 1,069 (50.6) | 762 (52.9) | 307 (45.5) | 280 (43.8) | 789 (53.5) | ||||
| > 5,000 | 1,045 (49.4) | 677 (47.1) | 368 (54.5) | 360 (56.2) | 685 (46.5) | ||||
| Physical activity | 5.27 | 0.072 | 138.66 | <0.001 | |||||
| Low | 712 (33.7) | 485 (33.7) | 227 (33.6) | 228 (35.6) | 484 (32.8) | ||||
| Moderate | 698 (33.0) | 495 (34.4) | 203 (30.1) | 107 (16.7) | 591 (40.1) | ||||
| Active | 704 (33.3) | 459 (31.9) | 245 (36.3) | 305 (47.7) | 399 (27.1) | ||||
| Attitude | t-value | P-value |
Subjective norms | t-value | P-value |
Perceived behavioral control | t-value | P-value |
Intention | t-value | P-value |
|
|---|---|---|---|---|---|---|---|---|---|---|---|---|
| Total | 4.04 ± 0.79 | 3.90 ± 0.80 | 3.82 ± 0.83 | 3.78 ± 0.88 | ||||||||
| Geographic region | –1.39 | 0.165 | 3.69 | <0.001 | 2.09 | 0.037 | 2.57 | 0.010 | ||||
| North | 4.03 ± 0.79 | 3.94 ± 0.79 | 3.85 ± 0.82 | 3.81 ± 0.87 | ||||||||
| South | 4.08 ± 0.80 | 3.80 ± 0.82 | 3.77 ± 0.83 | 3.71 ± 0.89 | ||||||||
| City-tier | –5.91 | < 0.001 | –5.16 | <0.001 | –4.90 | <0.001 | –4.76 | <0.001 | ||||
| First-tier | 3.84 ± 0.93 | 3.70 ± 0.91 | 3.63 ± 0.92 | 3.58 ± 0.97 | ||||||||
| Other cities | 4.13 ± 0.70 | 3.99 ± 0.73 | 3.91 ± 0.76 | 3.87 ± 0.83 | ||||||||
| City-tier and geographic region | ||||||||||||
| First-tier | –3.76 | < 0.001 | –0.90 | 0.371 | –2.22 | 0.027 | –2.12 | 0.034 | ||||
| North | 3.61 ± .1.00 | 3.59 ± 0.99 | 3.49 ± 0.98 | 3.42 ± 1.05 | ||||||||
| South | 3.98 ± 0.85 | 3.76 ± 0.85 | 3.72 ± 0.88 | 3.68 ± 0.91 | ||||||||
| Other cities | –3.79 | < 0.001 | 3.32 | 0.001 | 4.25 | <0.001 | 0.26 | 0.797 | ||||
| North | 4.11 ± 0.70 | 4.01 ± 0.72 | 3.92 ± 0.77 | 3.89 ± 0.81 | ||||||||
| South | 4.22 ± 0.69 | 3.86 ± 0.78 | 3.84 ± 0.75 | 3.74 ± 0.88 | ||||||||
| Between northern first-tier cities and other cities | –6.60 | < 0.001 | –5.28 | <0.001 | –5.73 | <0.001 | –5.65 | <0.001 | ||||
| Between southern first-tier cities and other cities | –1.71 | 0.088 | –0.48 | 0.633 | –0.03 | 0.974 | –0.31 | 0.754 |
| Factors |
Beta | SE | t | P-value |
||
|---|---|---|---|---|---|---|
| Independent variables | Dependent variables | |||||
| Geographic region north (ref = south) | Attitude | –0.03 | 0.37 | –1.39 | 0.165 | |
| Subjective norms | 0.08 | 0.04 | 3.74 | <0.001 | ||
| Perceived behavioral control | 0.05 | 0.04 | 2.09 | 0.037 | ||
| Intention | 0.06 | 0.04 | 2.57 | 0.010 | ||
| City tier other cities (ref = first-tier) | Attitude | 0.17 | 0.04 | 8.03 | <0.001 | |
| Subjective norms | 0.16 | 0.04 | 7.63 | <0.001 | ||
| Perceived behavioral control | 0.15 | 0.04 | 7.12 | <0.001 | ||
| Intention | 0.15 | 0.04 | 6.84 | <0.001 | ||
| City-tier by geographic region other cities (ref = first-tier) | North | Attitude | 0.20 | 0.05 | 7.64 | <0.001 |
| South | 0.07 | 0.06 | 1.71 | 0.088 | ||
| North | Subjective norms | 0.16 | 0.05 | 6.00 | <0.001 | |
| South | 0.02 | 0.06 | 0.48 | 0.633 | ||
| North | Perceived behavioral control | 0.16 | 0.05 | 6.27 | <0.001 | |
| South | 0.01 | 0.06 | 0.33 | 0.974 | ||
| North | Intention | 0.16 | 0.05 | 6.22 | <0.001 | |
| South | –0.01 | 0.07 | –0.31 | 0.754 | ||
| Geographic region and city-tier classification |
||||
|---|---|---|---|---|
| Theory of planned behavior constructs | First-tier cities in north (n=243) | Other cities in north (n=1,196) | First-tier cities in south (n=397) | Other cities in south (n=278) |
| Each construct as dependent variable | ||||
| Attitude | 1.00 | 3.57 |
2.08 |
6.06 |
| (2.62–4.86) | (1.48–2.92) | (3.94–9.31) | ||
| Subjective norms | 1.00 | 2.33 |
1.14 | 1.22 |
| (1.73–3.14) | (0.82–1.57) | (0.85–1.74) | ||
| Perceived behavioral control | 1.00 | 2.58 |
1.48 |
1.98 |
| (1.91–3.48) | (1.06–2.07) | (1.37–2.86) | ||
| Intention | 1.00 | 3.04 |
1.52 |
2.23 |
| (2.25–4.12) | (1.09–2.12) | (1.54–3.23) | ||
| Intention as a dependent variable including three constructs as independent variable | ||||
| Intention | 1.00 | 2.43 |
1.34 | 1.95 |
| (1.48–3.97) | (0.78–2.29) | (1.08–3.51) | ||
Table 1. General characteristics of participants by geographic region and city-tier classification
n (%). CNY, Chinese Yuan. chi-square test was used for comparison. The significance level for statistical analysis was
Table 2. Comparison of theory of planned behavior constructs by geographic region and city-tier classification
Mean ± SD. The significance level for statistical analysis was
Table 3. Linear regression results of the relationships among theory of planned behavior constructs by geographic region and city-tier classification
Adjusted for sex, age, alcohol consumption, lifetime smoking, presence of disease, living with family, employment status, education level, monthly income, and physical activity.
Table 4. Odds ratios (95% confidence intervals) for compliance with theory of planned behavior constructs by geographic region and city-tier classification (ref = first-tier in north)
Odds ratios or (95% confidence intervals). Adjusted for sex, age, alcohol consumption, lifetime smoking, presence of disease, living with family, employment status, education level, monthly income, and physical activity.


