
Articles
- Page Path
- HOME > Korean J Community Nutr > Volume 31(2); 2026 > Article
-
Research Article
한국 독거노인의 무상급식 이용에 따른 영양상태 및 식생활 관련 주관적 인식 비교: 단면 연구 -
정민주1)
 , 신다연2),†
 - A comparative study on nutritional status and diet-related subjective perceptions according to free meal service utilization among older adults living alone in Korea: a cross-sectional study
-
Minju Jeong1), Dayeon Shin2),†
-
Korean Journal of Community Nutrition 2026;31(2):165-177.
DOI: https://doi.org/10.5720/kjcn.2025.00339
Published online: April 30, 2026
1)인하대학교 식품영양학과 대학원생
2)이화여자대학교 식품영양학과 부교수
1)Master’s Student, Department of Food and Nutrition, Inha University, Incheon, Korea
2)Associate Professor, Department of Nutritional Science and Food Management, Ewha Womans University, Seoul, Korea
- †Corresponding author: Dayeon Shin Department of Nutritional Science and Food Management, Ewha Womans University, 52 Ewhayeodae-gil, Seodaemun-gu, Seoul 03760, Korea Tel: +82-2-3277-4488 Email: dayeonshin@ewha.ac.kr
• Received: November 7, 2025 • Revised: January 6, 2026 • Accepted: January 22, 2026
© 2026 The Korean Society of Community Nutrition
This is an Open-Access article distributed under the terms of the Creative Commons Attribution Non-Commercial License (https://creativecommons.org/licenses/by-nc/4.0) which permits unrestricted non-commercial use, distribution, and reproduction in any medium, provided the original work is properly cited.
- 552 Views
- 30 Download
Abstract
-
Objectives
- To assess whether the use of free meal services is associated with diet quality among older adults living alone in Incheon, Korea, by comparing the Nutrition Quotient for the Elderly (NQ-E), index of nutritional quality (INQ), and mean adequacy ratio (MAR).
-
Methods
- A cross-sectional survey was conducted from March 5 to April 24, 2025 using one-to-one interviews and partially self-administered questionnaires. After excluding cases with missing responses or energy intake of < 500 kcal/day, 119 participants were analyzed (56 men and 63 women). A single 24-hour recall was used to calculate INQ and MAR. NQ-E was evaluated using total and subdomain scores. Group comparisons and sex-stratified multiple linear regression analyses were performed.
-
Results
- Diet-quality indicators were higher among service users than among non-users. INQ for thiamin and riboflavin was significantly higher in men than in women. Meanwhile, INQ for zinc, vitamin A, riboflavin, and folate was higher in women than in men. In both sexes, MAR was higher among users than among non-users (men: 0.8 ± 0.2 vs. 0.6 ± 0.2; women: 0.7 ± 0.2 vs. 0.5 ± 0.2; P < 0.001 for all). Differences in NQ-E total scores were small. Among women, the practice subdomain score was higher in users than in non-users (66.0 ± 16.4 vs. 55.2 ± 15.5; P = 0.016), and the proportion in upper grades was greater (P = 0.030). Regression analysis showed that service use was negatively associated with NQ-E in men (P = 0.007) and positively associated with MAR in women (P = 0.010).
-
Conclusion
- Use of free meal services was associated with improved diet quality, as reflected by MAR and INQ for specific nutrients, and with higher NQ-E practice scores observed in women than in men. Policies should prioritize food-insecure groups and support sustained participation.
INTRODUCTION
METHODS
1) 설문조사
2) 설문구성 및 신체정보
3) 식품섭취 조사 및 영양지표 산출
RESULTS
1) NQ-E 관련성
2) MAR 관련성
1) 건강·영양·경제·사회·신체 요인 인식
2) 자각된 건강 상태, 영양 상태 및 식생활 관련 주관적 인식차이
DISCUSSION
-
CONFLICT OF INTEREST
There are no financial or other issues that might lead to conflict of interest.
-
FUNDING
This work was supported by a National Research Foundation of Korea grant funded by the Korean Government (MSIT) (RS-2024-00340086).
-
DATA AVAILABILITY
The survey data that support the findings of this study are not publicly available due to ethical and privacy considerations, as participants did not provide consent for public data sharing. However, anonymized data that do not contain identifiable individual-level information are available from the authors upon reasonable request.
NOTES
Fig. 1.Perceived health, nutritional status, and diet-related factors according to free meal service use among men and women. P-values were estimated using the Mann-Whitney U test. Perceived health and nutritional status were rated on a 5-point likert scale: 1 = very poor, 2 = poor, 3 = fair, 4 = good, 5 = very good. Perceived economic, social, and physical factors were rated on a 5-point likert scale: 1 = very influential, 2 = influential, 3 = neutral, 4 = hardly influential, 5 = not at all influential. *P < 0.05, **P < 0.01.
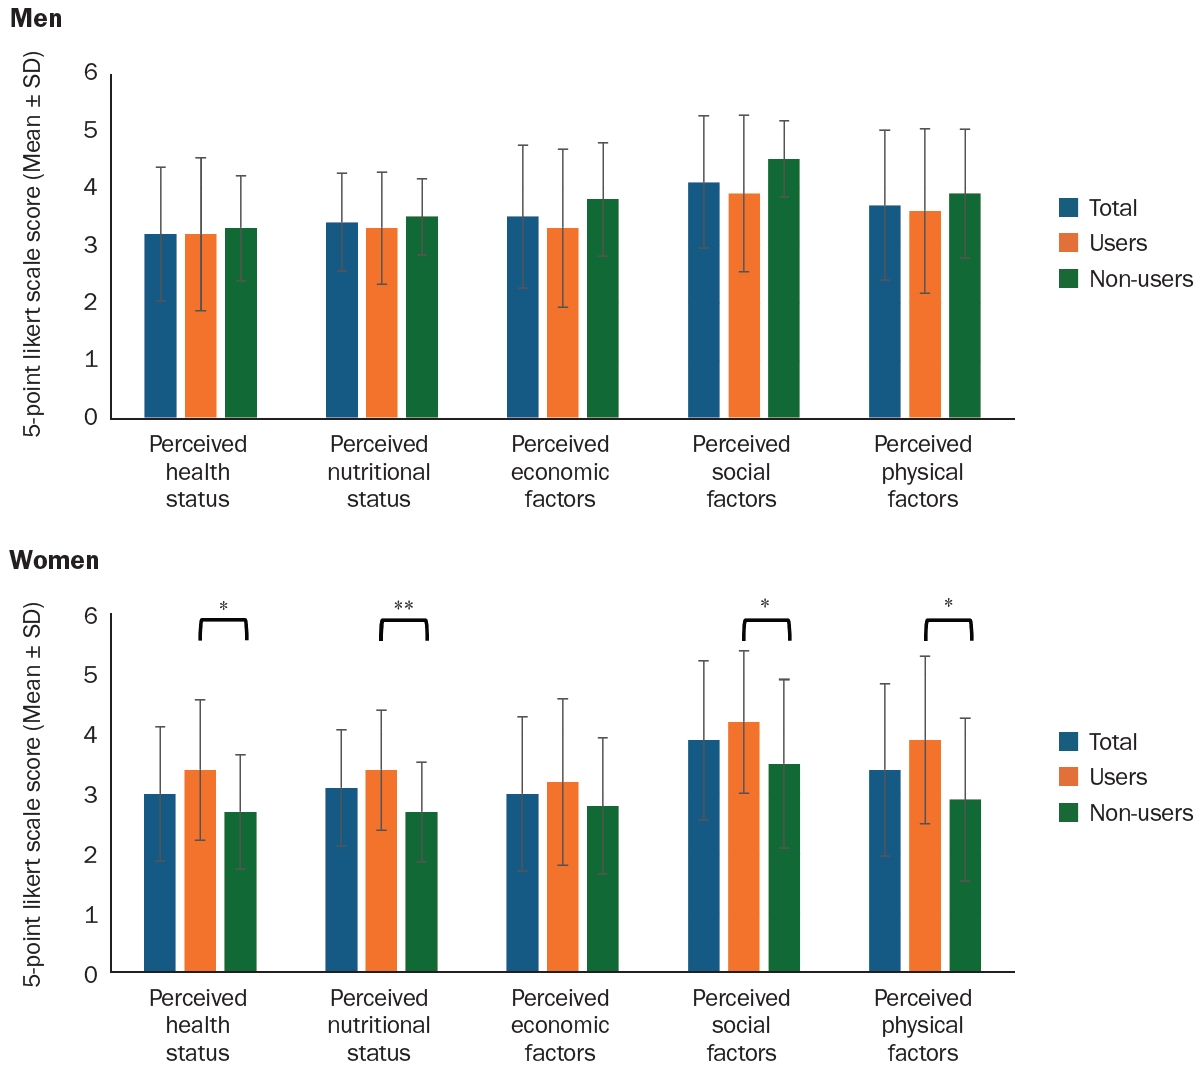
Table 1.General and physical characteristics of study participants
| Variable | Total (n = 56) | Men | P-value1) | Total (n = 63) | Women | P-value1) | ||
|---|---|---|---|---|---|---|---|---|
| Users (n = 32) | Non-users (n = 24) | Users (n = 33) | Non-users (n = 30) | |||||
| Number of participants | 56 (100) | 32 (57.1) | 24 (42.9) | - | 63 (100) | 33 (52.4) | 30 (47.6) | - |
| Age (year) | 76.2 ± 6.8 | 75.3 ± 6.8 | 77.5 ± 6.7 | 0.277 | 81.8 ± 6.8 | 82.8 ± 5.6 | 80.7 ± 7.7 | 0.324 |
| Education level | < 0.001 | 0.307 | ||||||
| No formal education | 5 (8.9) | 5 (15.6) | 0 (0.0) | 14 (22.2) | 7 (21.2) | 7 (23.3) | ||
| Elementary school graduate | 9 (16.1) | 5 (15.6) | 4 (16.7) | 22 (34.9) | 13 (39.4) | 9 (30.0) | ||
| Middle school graduate | 12 (21.4) | 12 (37.5) | 0 (0.0) | 17 (27.0) | 6 (18.2) | 11 (36.7) | ||
| High school graduate | 20 (35.7) | 6 (18.8) | 14 (58.3) | 10 (15.9) | 7 (21.2) | 3 (10.0) | ||
| University graduate | 9 (16.1) | 4 (12.5) | 5 (20.8) | 0 (0.0) | 0 (0.0) | 0 (0.0) | ||
| Graduate school or above | 1 (1.8) | 0 (0.0) | 1 (4.2) | 0 (0.0) | 0 (0.0) | 0 (0.0) | ||
| Housing ownership type | < 0.001 | < 0.001 | ||||||
| Owned | 29 (51.8) | 6 (18.8) | 23 (95.8) | 29 (46.0) | 8 (24.2) | 21 (70.0) | ||
| Lease | 4 (7.1) | 4 (12.5) | 0 (0.0) | 10 (15.9) | 5 (15.2) | 5 (16.7) | ||
| Monthly rent | 18 (32.1) | 17 (53.1) | 1 (4.2) | 20 (31.7) | 16 (48.5) | 4 (13.3) | ||
| Facility | 2 (3.6) | 2 (6.3) | 0 (0.0) | 0 (0.0) | 0 (0.0) | 0 (0.0) | ||
| Unknown | 3 (5.4) | 3 (9.4) | 0 (0.0) | 4 (6.3) | 4 (12.1) | 0 (0.0) | ||
| Economic status | 0.001 | 0.293 | ||||||
| Very good | 2 (3.6) | 1 (3.1) | 1 (4.2) | 0 (0.0) | 0 (0.0) | 0 (0.0) | ||
| Good | 6 (10.7) | 3 (9.4) | 3 (12.5) | 7 (11.1) | 4 (12.1) | 3 (10.0) | ||
| Average | 31 (55.4) | 12 (37.5) | 19 (79.2) | 32 (50.8) | 16 (48.5) | 16 (53.3) | ||
| Poor | 15 (26.8) | 14 (43.8) | 1 (4.2) | 21 (33.3) | 13 (39.4) | 8 (26.7) | ||
| Very poor | 2 (3.6) | 2 (6.3) | 0 (0.0) | 3 (4.8) | 0 (0.0) | 3 (10.0) | ||
| Frequency of contact with family/friends | 0.276 | 0.091 | ||||||
| Hardly ever | 7 (12.5) | 6 (18.8) | 1 (4.2) | 7 (11.1) | 4 (12.1) | 3 (10.0) | ||
| 1–2 times a month | 9 (16.1) | 3 (9.4) | 6 (25.0) | 3 (4.8) | 1 (3.0) | 2 (6.7) | ||
| 1–2 times a week | 14 (25.0) | 7 (21.9) | 7 (29.2) | 15 (23.8) | 4 (12.1) | 11 (36.7) | ||
| Almost every day | 22 (39.3) | 14 (43.8) | 8 (33.3) | 33 (52.4) | 22 (66.7) | 11 (36.7) | ||
| Several times a day | 4 (7.1) | 2 (6.3) | 2 (8.3) | 5 (7.9) | 2 (6.1) | 3 (10.0) | ||
| Meal preparation ability | 0.398 | 0.071 | ||||||
| Not difficult at all | 26 (46.4) | 14 (43.8) | 12 (50.0) | 35 (55.6) | 23 (69.7) | 12 (40.0) | ||
| Slightly difficult | 15 (26.8) | 8 (25.0) | 7 (29.2) | 20 (31.7) | 8 (24.2) | 12 (40.0) | ||
| Fairly difficult | 8 (14.3) | 7 (21.9) | 1 (4.2) | 7 (11.1) | 2 (6.1) | 5 (16.7) | ||
| Almost unable | 5 (8.9) | 2 (6.3) | 3 (12.5) | 1 (1.6) | 0 (0.0) | 1 (3.3) | ||
| Completely unable | 2 (3.6) | 1 (3.1) | 1 (4.2) | 0 (0.0) | 0 (0.0) | 0 (0.0) | ||
| Number of chronic diseases | 0.259 | 0.718 | ||||||
| None | 11 (19.6) | 8 (25.0) | 3 (12.5) | 3 (4.8) | 1 (3.0) | 2 (6.7) | ||
| 1 chronic disease | 16 (28.6) | 9 (28.1) | 7 (29.2) | 18 (28.6) | 8 (24.2) | 10 (33.3) | ||
| 2 chronic disease | 12 (21.4) | 4 (12.5) | 8 (33.3) | 13 (20.6) | 7 (21.2) | 6 (20.0) | ||
| 3 or more chronic diseases | 17 (30.4) | 11 (34.4) | 6 (25.0) | 29 (46.0) | 17 (51.5) | 12 (40.0) | ||
| Height (cm) | 165.6 ± 5.6 | 165.0 ± 6.6 | 166.4 ± 3.7 | 0.405 | 154.0 ± 5.6 | 152.8 ± 6.3 | 155.3 ± 4.6 | 0.085 |
| Weight (kg) | 64.9 ± 7.4 | 64.4 ± 8.9 | 65.5 ± 4.8 | 0.435 | 54.2 ± 9.3 | 53.2 ± 7.0 | 55.3 ± 11.4 | 0.490 |
| BMI (kg/m2)2) | 0.730 | 0.110 | ||||||
| Underweight | 1 (1.8) | 1 (3.1) | 0 (0.0) | 6 (9.5) | 2 (6.1) | 4 (13.3) | ||
| Normal | 23 (41.1) | 13 (40.6) | 10 (31.3) | 27 (42.9) | 13 (39.4) | 14 (46.7) | ||
| Pre-obese | 17 (30.4) | 10 (31.3) | 7 (29.2) | 17 (27.0) | 13 (39.4) | 4 (13.3) | ||
| Obese Class I | 13 (23.2) | 6 (18.8) | 7 (29.2) | 11 (17.5) | 5 (15.2) | 6 (20.0) | ||
| Obese Class II | 2 (3.6) | 2 (6.3) | 0 (0.0) | 2 (3.2) | 0 (0.0) | 2 (6.7) | ||
| Obese Class III | 0 (0.0) | 0 (0.0) | 0 (0.0) | 0 (0.0) | 0 (0.0) | 0 (0.0) | ||
n (%) or Mean ± SD.
BMI, body mass index.
1)P-values were estimated using Fisher’s exact test and the Mann-Whitney U test.
2)Obesity classification: underweight (< 18.5 kg/m2), normal (18.5–22.9 kg/m2), pre-obesity (23.0–24.9 kg/m2), obesity class I (25.0–29.9 kg/m2), obesity class II (30.0–34.9 kg/m2), and obesity class III (≥ 35 kg/m2).
Table 2.Nutritional quality indices (INQ, MAR) from 24-hour dietary recall
| Variable | Total (n = 56) | Men | P-value1) | Total (n = 63) | Women | P-value1) | ||
|---|---|---|---|---|---|---|---|---|
| Users (n = 32) | Non-users (n = 24) | Users (n = 33) | Non-users (n = 30) | |||||
| INQ2) | ||||||||
| Protein (g) | 1.3 ± 0.3 | 1.3 ± 0.4 | 1.2 ± 0.3 | 0.655 | 1.1 ± 0.3 | 1.2 ± 0.2 | 1.1 ± 0.3 | 0.165 |
| Ca (mg) | 1.0 ± 0.4 | 1.1 ± 0.4 | 0.9 ± 0.4 | 0.132 | 0.7 ± 0.3 | 0.7 ± 0.4 | 0.6 ± 0.3 | 0.536 |
| P (mg) | 1.8 ± 0.4 | 1.8 ± 0.4 | 1.9 ± 0.3 | 0.529 | 1.4 ± 0.3 | 1.4 ± 0.2 | 1.3 ± 0.4 | 0.322 |
| Fe (mg) | 2.1 ± 1.7 | 2.0 ± 0.8 | 2.1 ± 2.5 | 0.055 | 1.6 ± 0.5 | 1.7 ± 0.6 | 1.4 ± 0.4 | 0.074 |
| Zn (mg) | 0.9 ± 0.3 | 0.9 ± 0.3 | 0.9 ± 0.3 | 0.817 | 0.9 ± 0.3 | 1.0 ± 0.3 | 0.8 ± 0.4 | 0.012 |
| Vitamin A (μg RAE) | 0.8 ± 0.7 | 0.9 ± 0.9 | 0.6 ± 0.5 | 0.180 | 0.7 ± 0.6 | 0.9 ± 0.7 | 0.5 ± 0.4 | < 0.001 |
| Vitamin B1 (mg) | 1.3 ± 0.4 | 1.3 ± 0.4 | 1.2 ± 0.3 | 0.037 | 1.3 ± 0.5 | 1.4 ± 0.5 | 1.2 ± 0.5 | 0.296 |
| Vitamin B2 (mg) | 1.1 ± 0.5 | 1.2 ± 0.6 | 1.0 ± 0.3 | 0.024 | 1.1 ± 0.3 | 1.2 ± 0.3 | 1.0 ± 0.4 | 0.019 |
| Vitamin B6 (mg) | 0.3 ± 0.3 | 0.3 ± 0.3 | 0.3 ± 0.3 | 0.791 | 0.2 ± 0.2 | 0.2 ± 0.2 | 0.2 ± 0.2 | 0.231 |
| Vitamin B12 (μg) | 1.5 ± 1.2 | 1.5 ± 1.4 | 1.4 ± 1.0 | 0.631 | 1.2 ± 1.8 | 0.8 ± 0.5 | 1.5 ± 2.5 | 0.308 |
| Niacin (NE) (mg) | 1.0 ± 0.4 | 0.9 ± 0.4 | 1.1 ± 0.3 | 0.059 | 0.9 ± 0.3 | 0.9 ± 0.4 | 0.8 ± 0.3 | 0.052 |
| Vitamin C (mg) | 1.2 ± 2.0 | 1.3 ± 2.3 | 1.1 ± 1.7 | 0.132 | 0.9 ± 0.9 | 0.9 ± 0.9 | 0.8 ± 1.0 | 0.104 |
| Folate (DFE) (μg) | 1.0 ± 0.6 | 1.1 ± 0.7 | 1.0 ± 0.5 | 0.631 | 0.8 ± 0.4 | 0.9 ± 0.4 | 0.7 ± 0.3 | 0.032 |
| MAR3) | 0.7 ± 0.2 | 0.8 ± 0.2 | 0.6 ± 0.2 | < 0.001 | 0.6 ± 0.2 | 0.7 ± 0.2 | 0.5 ± 0.2 | < 0.001 |
Mean ± SD.
INQ, index of nutritional quality; MAR, mean adequacy ratio; μg RAE, μg retinol activity equivalent; NE, niacin equivalent; DFE, dietary folate equivalent.
1)P-values were estimated using the Mann-Whitney U test.
2)INQ was calculated as the ratio of nutrient intake per 1,000 kcal to the recommended intake per 1,000 kcal.
3)Nutrient adequacy ratio (NAR) was calculated by dividing nutrient intake by the recommended intake, with values restricted to 1. MAR represents the mean NAR across 13 nutrients: protein, calcium, phosphorus, iron, zinc, vitamin A, vitamin B1, vitamin B2, vitamin B6, vitamin B12, niacin, vitamin C, and folate.
Table 3.Total and subdomain scores and levels of the NQ-E
| Variable | Total (n = 56) | Men | P-value1) | Total (n = 63) | Women | P-value1) | ||
|---|---|---|---|---|---|---|---|---|
| Users (n = 32) | Non-users (n = 24) | Users (n = 33) | Non-users (n = 30) | |||||
| NQ-E score | ||||||||
| Nutrition Index | 53.9 ± 15.2 | 50.2 ± 14.5 | 58.9 ± 14.9 | 0.051 | 56.2 ± 13.5 | 59.3 ± 12.0 | 52.8 ± 14.4 | 0.107 |
| Balance | 47.8 ± 20.2 | 44.0 ± 19.0 | 53.0 ± 20.9 | 0.143 | 52.3 ± 17.5 | 55.9 ± 17.6 | 48.4 ± 16.9 | 0.132 |
| Moderation | 53.3 ± 37.2 | 45.7 ± 37.2 | 63.3 ± 35.3 | 0.098 | 61.2 ± 33.3 | 54.1 ± 32.0 | 69.0 ± 33.4 | 0.162 |
| Practice | 63.7 ± 18.1 | 61.3 ± 21.3 | 66.8 ± 12.5 | 0.337 | 60.9 ± 16.7 | 66.0 ± 16.4 | 55.2 ± 15.5 | 0.016 |
| NQ-E score (level) | 0.354 | 0.590 | ||||||
| High | 22 (39.3) | 10 (31.3) | 12 (50.0) | 29 (46.0) | 17 (51.5) | 12 (40.0) | ||
| Medium | 21 (37.5) | 13 (40.6) | 8 (33.3) | 22 (34.9) | 11 (33.3) | 11 (36.7) | ||
| Low | 13 (23.2) | 9 (28.1) | 4 (16.7) | 12 (19.0) | 5 (15.2) | 7 (23.3) | ||
| Balance score (level) | 0.615 | 0.242 | ||||||
| High | 21 (37.5) | 12 (37.5) | 9 (37.5) | 28 (44.4) | 18 (54.5) | 10 (33.3) | ||
| Medium | 20 (35.7) | 10 (31.3) | 10 (41.7) | 25 (39.7) | 11 (33.3) | 14 (46.7) | ||
| Low | 15 (26.8) | 10 (31.3) | 5 (20.8) | 10 (15.9) | 4 (12.1) | 6 (20.0) | ||
| Moderation score (level) | 0.329 | 0.141 | ||||||
| High | 23 (41.1) | 11 (34.4) | 12 (50.0) | 28 (44.4) | 11 (33.3) | 17 (56.7) | ||
| Medium | 13 (23.2) | 7 (21.9) | 6 (25.0) | 26 (41.3) | 17 (51.5) | 9 (30.0) | ||
| Low | 20 (35.7) | 14 (43.8) | 6 (25.0) | 9 (14.3) | 5 (15.2) | 4 (13.3) | ||
| Practice score (level) | 0.243 | 0.030 | ||||||
| High | 21 (37.5) | 11 (34.4) | 10 (41.7) | 15 (23.8) | 12 (36.4) | 3 (10.0) | ||
| Medium | 19 (33.9) | 9 (28.1) | 10 (41.7) | 24 (38.1) | 12 (36.4) | 12 (40.0) | ||
| Low | 16 (28.6) | 12 (37.5) | 4 (16.7) | 24 (38.1) | 9 (27.3) | 15 (50.0) | ||
Table 4.Multiple linear regression of the NQ-E in relation to free meal service use
NQ-E, Nutrition Quotient for the Elderly; B, unstandardized coefficient; SE, standard error; β, standardized coefficient; t, t-statistic testing.
The model was adjusted for age, education level (ref.: rarely/never attended school), energy intake, food security status (ref.: sufficient quantity and variety), breakfast frequency (ref.: 5–7 days/week), contact frequency (ref.: rarely/almost never), and physical difficulty (ref.: none/no effect on eating).
Table 5.Multiple linear regression of the MAR in relation to free meal service use
MAR, mean adequacy ratio; B, unstandardized coefficient; SE, standard error; β, standardized coefficient; t, t-statistic testing.
The model was adjusted for age, education level (ref.: rarely/never attended school), energy intake, food security status (ref.: sufficient quantity and variety), breakfast frequency (ref.: 5–7 days/week), contact frequency (ref.: rarely/almost never), and physical difficulty (ref.: none/no effect on eating).
Table 6.Perceived health, nutrition, and diet-related factors by free meal service use
- 1. Korean Statistical Information Service. Future population projections: population by major age groups (working-age, older adults) [Internet]. Ministry of Data and Statistics; 2023 [cited 2025 May 16]. Available from: https://kosis.kr/statHtml/statHtml.do?orgId=101&tblId=DT_1BPA003&conn_path=I2
- 2. e-Narajipyo. Share of older adults living alone [Internet]. Ministry of Data and Statistics; 2024 [cited 2025 May 16]. Available from: https://www.index.go.kr/unify/idx-info.do?idxCd=8039
- 3. Han M, Woo K, Kim K. Association of protein intake with sarcopenia and related indicators among Korean older adults: a systematic review and meta-analysis. Nutrients 2024; 16(24): 4350.ArticlePubMedPMC
- 4. Jeon S, Kim Y, Min S, Song M, Son S, Lee S. Taste sensitivity of elderly people is associated with quality of life and inadequate dietary intake. Nutrients 2021; 13(5): 1693.ArticlePubMedPMC
- 5. Hughes CF, Ward M, Tracey F, Hoey L, Molloy AM, Pentieva K, et al. B-vitamin intake and biomarker status in relation to cognitive decline in healthy older adults in a 4-year follow-up study. Nutrients 2017; 9(1): 53.ArticlePubMedPMC
- 6. Oh JH, Jung BM. Comparison analysis of dietary behavior and nutrient intakes of the elderly according to their family status: the Korea National Health and Nutrition Examination Survey 2013-2016. Korean J Community Nutr 2019; 24(4): 309-320. ArticleLink
- 7. Public Data Portal. National standard dataset of free meal service facilities [Internet]. Ministry of the Interior and Safety; 2025 [cited 2025 May 23]. Available from: https://www.data.go.kr/data/15013107/standard.do
- 8. Ministry of Health and Welfare (MOHW). 2025 Guidelines for elderly health and welfare services. Vol. 1 [Internet]. MOHW; 2025 [cited 2025 May 23]. Available from: https://www.mohw.go.kr/board.es?mid=a10411010100&bid=0019&act=view&list_no=1484915
- 9. Park SH, Park JD, Kim JI. Delphi and AHP analysis on the satisfaction factors of free lunch service for the elderly in permanent rental apartment : focusing on the users of M social welfare center in N-gu. Korean NPO Rev 2022; 21(2): 19-32. Link
- 10. Ahn SM, Lee YH. Satisfaction with the provision of free meals (alternative meals) in the context of COVID-19. J Coun Welfare Manag 2021; 6: 51-66.
- 11. Cho H, Chang H, Kim J. Evaluation of nutritional status among the vulnerable elderly: focused on the recipients of meals-on-wheels. J Korean Soc Food Sci Nutr 2020; 49(5): 521-530. Article
- 12. Chang H, Kim J, Park C. Evaluation of the physical health and dietary intake of the low-income elderly with impaired mobility for the design of a health meals-on-wheels intervention program in Seoul. J Korean Soc Food Sci Nutr 2023; 52(7): 740-749. Article
- 13. Cho J, Choi J. The impact of food insecurity on depression among the poor elderly: moderating effect of free meal service and meals on wheels service. Korean Soc Security Stud 2020; 36(3): 163-189. Link
- 14. Korea Disease Control and Prevention Agency (KDCA). Guidelines for the nutrition survey: KNHANES IX (2022-2024) [Internet]. KDCA; 2023 [cited 2025 May 27]. Available from: https://knhanes.kdca.go.kr/knhanes/postSendPage.do?url=/archive/wsiPerfInst.do&postparam=%7B%22menuId%22:%2210041008%22%7D
- 15. Ministry of Food and Drug Safety (MFDS). Nutrition index checklist (seniors, 65 years of age and older) [Internet]. MFDS; n.d. [cited 2025 Jun 5]. Available from: https://various.foodsafetykorea.go.kr/nq/oldman_survey.html.
- 16. Korean Society for the Study of Obesity. Clinical practice guidelines for obesity 2022 (8th ed.): summary version [Internet]. Korean Society for the Study of Obesity; 2022 [cited 2025 Jun 20]. Available from: https://general.kosso.or.kr/html/?pmode=BBBS0001300003&page=1&smode=view&seq=1383
- 17. Lee YN, Kim CI, Jang YA, Lee HS, Lee HJ, Moon JJ, et al. Development of food and nutrient database - food portion/weight database -. Korea Health Industry Development Institute; 2007 Dec. Report No. TRKO201100002804. Link
- 18. Chung MJ, Kwak TK, Kim HY, Kang MH, Lee JS, Chung HR, et al. Development of NQ-E, Nutrition Quotient for Korean Elderly: item selection and validation of factor structure. J Nutr Health 2018; 51(1): 87-102. ArticleLink
- 19. Lim YS, Lee JS, Hwang JY, Kim KN, Hwang HJ, Kwon S, et al. Revision of Nutrition Quotient for Elderly in assessment of dietary quality and behavior. J Nutr Health 2022; 55(1): 155-173. ArticleLink
- 20. Lee Y, Yang N, Shin M, Lee KE, Yoo CH, Kim K. The effects of a personalized nutrition intervention program on food security, health and nutritional status of low-income older adults in Seoul city. J Nutr Health 2020; 53(4): 416-430. ArticleLink
- 21. MacMillan Uribe AL, Szeszulski J, Borchers L, Eicher-Miller HA, Seguin-Fowler RA, Largacha Cevallos E. Diet quality of community café meals among guests with food insecurity. J Nutr Educ Behav 2024; 56(8): 579-587. ArticlePubMedPMC
- 22. Ullevig SL, Sosa ET, Crixell S, Uc E, Greenwald B, Marceaux S, et al. Impact of home-delivered meals on nutrition status and nutrient intake among older adults in Central Texas. J Nutr Health Aging 2018; 22(7): 861-868. ArticlePubMedPDF
- 23. Walton K, do Rosario VA, Pettingill H, Cassimatis E, Charlton K. The impact of home-delivered meal services on the nutritional intake of community living older adults: a systematic literature review. J Hum Nutr Diet 2020; 33(1): 38-47. ArticlePubMedLink
- 24. Campbell AD, Godfryd A, Buys DR, Locher JL. Does participation in home-delivered meals programs improve outcomes for older adults? Results of a systematic review. J Nutr Gerontol Geriatr 2015; 34(2): 124-167. ArticlePubMedPMC
- 25. Kim GW, Hur JS. A study on factor influencing the Nutrition Quotient for Elderly (NQ-E) of elderly living alone. J Korean Gerontol Soc 2019; 39(4): 741-762. Article
- 26. Seo EH. A study on the dietary status according to social frailty stage of the female elderly in Changwon City. J Korean Soc Ind Converg 2022; 25(5): 725-739. Article
- 27. Ham SW, Kim KH. Evaluation of the dietary quality and nutritional status of elderly people using the Nutrition Quotient for Elderly (NQ-E) in Seoul. J Nutr Health 2020; 53(1): 68-82. ArticleLink
- 28. Lee JJ, Sultana N, Nishita C. A flexible congregate meal program for older adults in Hawai’i: a quasi-experimental evaluation of Kūpuna U. Nutrients 2025; 17(13): 2106.ArticlePubMedPMC
- 29. Fleury S, Tronchon P, Rota J, Meunier C, Mardiros O, Van Wymelbeke-Delannoy V, et al. The nutritional issue of older people receiving home-delivered meals: a systematic review. Front Nutr 2021; 8: 629580.ArticlePubMedPMC
- 30. Seo EH. Factors affecting Nutrition Quotient for Elderly (NQ-E) for the elderly in Changwon City. Korean J Food Nutr 2022; 35(2): 75-87. Article
- 31. Tsofliou F, Grammatikopoulou MG, Lumley R, Gkiouras K, Lara J, Clark C. Effects of lunch club attendance on the dietary intake of older adults in the UK: a pilot cross-sectional study. Nutr Health 2020; 26(3): 209-214. ArticlePubMedPMCLink
- 32. Thomas KS, Akobundu U, Dosa D. More than a meal? A randomized control trial comparing the effects of home-delivered meals programs on participants’ feelings of loneliness. J Gerontol B Psychol Sci Soc Sci 2016; 71(6): 1049-1058. ArticlePubMed
- 33. Cho JY. Factors associated with food insecurity among the Korean elderly: using ordered logistic regression analysis. Health Soc Welf Rev 2015; 35(4): 375-406. Article
- 34. Han EH, Jeong SD. Prevalence of and factors associated with food insecurity among the mid and old age householders by age group in South Korea. Korean J Gerontol Soc Welf 2018; 73(2): 141-170. Article
- 35. Shin HS, Im AJ, Lim HJ. Socioeconomic status, food security, and chewing discomfort of Korean elders: results from the Korea National Health and Nutrition Examination Survey. Nutr Res Pract 2022; 16(1): 94-105. ArticlePubMedPMCLink
- 36. Sung S, Lee KE. Current practices and tailoring strategies of foodservice programs for vulnerable older adults in Seoul. J Korean Soc Food Sci Nutr 2019; 48(12): 1431-1439. Article
- 37. Choi JH, Kim DH, Choi EH, Chung MJ, Lee HS, Lee MJ, et al. Assessment of foodservice management practices according to types of elderly foodservice facilities. J Korean Soc Food Sci Nutr 2019; 48(4): 469-481. Article
- 38. Choi JH, Yi NY. Monitoring and importance-performance analysis of food sanitation management at home-delivered meal service operations for older adults. Food Serv Ind J 2020; 16(3): 81-97. Article
- 39. Choi JH, Yi NY. Evaluation of employees’ and volunteers’ food safety knowledge and practices for production, packaging, holding, and delivery stages in home-delivered meal service for the elderly. J Korean Soc Food Sci Nutr 2024; 53(2): 214-222. Article
- 40. Gu S. Current status and challenges of meal support for older adults in a super-aged society: implications of 5-day-a-week meals at senior centers [Internet]. National Assembly Research Service; 2024 [cited 2025 Aug 8]. Available from: https://www.nars.go.kr/report/view.do?cmsCode=CM0043&brdSeq=44860
- 41. Kim J, Kim E, Whang E, Kim HS, Kim Y, Lim H, et al. Strategies for improving community meal care services for older adults. Korea Institute for Health and Social Affairs; 2023 Dec. Report No. 2023-18. Link
REFERENCES
Figure & Data
REFERENCES
Citations
Citations to this article as recorded by 
 Cite
Cite- Figure
-
- We recommend
- Related articles
-
- Nutrition Quotient and nutrient intake among older adults in a rural Korean community: a cross-sectional study
- Comparison of clinical characteristics and dietary intakes according to phenotypes of type 2 diabetes mellitus in South Korea: a cross-sectional study
- Eating habits and dietary supplement utilization according to food-related lifestyle among Korean adults: a cross-sectional study
A comparative study on nutritional status and diet-related subjective perceptions according to free meal service utilization among older adults living alone in Korea: a cross-sectional study
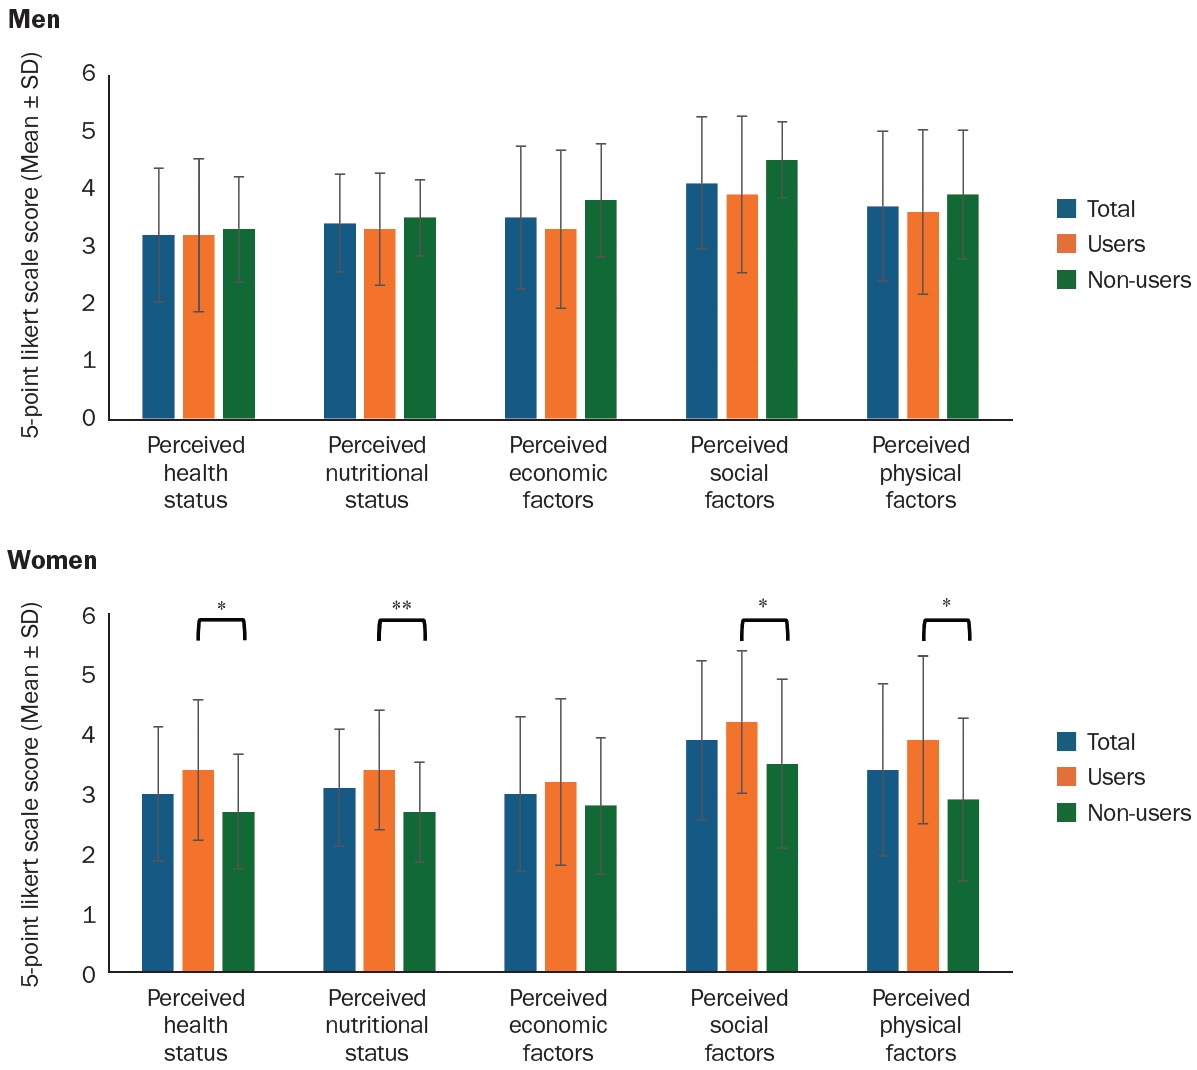
Fig. 1. Perceived health, nutritional status, and diet-related factors according to free meal service use among men and women. P-values were estimated using the Mann-Whitney U test. Perceived health and nutritional status were rated on a 5-point likert scale: 1 = very poor, 2 = poor, 3 = fair, 4 = good, 5 = very good. Perceived economic, social, and physical factors were rated on a 5-point likert scale: 1 = very influential, 2 = influential, 3 = neutral, 4 = hardly influential, 5 = not at all influential. *P < 0.05, **P < 0.01.
Fig. 1.
A comparative study on nutritional status and diet-related subjective perceptions according to free meal service utilization among older adults living alone in Korea: a cross-sectional study
| Variable | Total (n = 56) | Men | P-value |
Total (n = 63) | Women | P-value |
||
|---|---|---|---|---|---|---|---|---|
| Users (n = 32) | Non-users (n = 24) | Users (n = 33) | Non-users (n = 30) | |||||
| Number of participants | 56 (100) | 32 (57.1) | 24 (42.9) | - | 63 (100) | 33 (52.4) | 30 (47.6) | - |
| Age (year) | 76.2 ± 6.8 | 75.3 ± 6.8 | 77.5 ± 6.7 | 0.277 | 81.8 ± 6.8 | 82.8 ± 5.6 | 80.7 ± 7.7 | 0.324 |
| Education level | < 0.001 | 0.307 | ||||||
| No formal education | 5 (8.9) | 5 (15.6) | 0 (0.0) | 14 (22.2) | 7 (21.2) | 7 (23.3) | ||
| Elementary school graduate | 9 (16.1) | 5 (15.6) | 4 (16.7) | 22 (34.9) | 13 (39.4) | 9 (30.0) | ||
| Middle school graduate | 12 (21.4) | 12 (37.5) | 0 (0.0) | 17 (27.0) | 6 (18.2) | 11 (36.7) | ||
| High school graduate | 20 (35.7) | 6 (18.8) | 14 (58.3) | 10 (15.9) | 7 (21.2) | 3 (10.0) | ||
| University graduate | 9 (16.1) | 4 (12.5) | 5 (20.8) | 0 (0.0) | 0 (0.0) | 0 (0.0) | ||
| Graduate school or above | 1 (1.8) | 0 (0.0) | 1 (4.2) | 0 (0.0) | 0 (0.0) | 0 (0.0) | ||
| Housing ownership type | < 0.001 | < 0.001 | ||||||
| Owned | 29 (51.8) | 6 (18.8) | 23 (95.8) | 29 (46.0) | 8 (24.2) | 21 (70.0) | ||
| Lease | 4 (7.1) | 4 (12.5) | 0 (0.0) | 10 (15.9) | 5 (15.2) | 5 (16.7) | ||
| Monthly rent | 18 (32.1) | 17 (53.1) | 1 (4.2) | 20 (31.7) | 16 (48.5) | 4 (13.3) | ||
| Facility | 2 (3.6) | 2 (6.3) | 0 (0.0) | 0 (0.0) | 0 (0.0) | 0 (0.0) | ||
| Unknown | 3 (5.4) | 3 (9.4) | 0 (0.0) | 4 (6.3) | 4 (12.1) | 0 (0.0) | ||
| Economic status | 0.001 | 0.293 | ||||||
| Very good | 2 (3.6) | 1 (3.1) | 1 (4.2) | 0 (0.0) | 0 (0.0) | 0 (0.0) | ||
| Good | 6 (10.7) | 3 (9.4) | 3 (12.5) | 7 (11.1) | 4 (12.1) | 3 (10.0) | ||
| Average | 31 (55.4) | 12 (37.5) | 19 (79.2) | 32 (50.8) | 16 (48.5) | 16 (53.3) | ||
| Poor | 15 (26.8) | 14 (43.8) | 1 (4.2) | 21 (33.3) | 13 (39.4) | 8 (26.7) | ||
| Very poor | 2 (3.6) | 2 (6.3) | 0 (0.0) | 3 (4.8) | 0 (0.0) | 3 (10.0) | ||
| Frequency of contact with family/friends | 0.276 | 0.091 | ||||||
| Hardly ever | 7 (12.5) | 6 (18.8) | 1 (4.2) | 7 (11.1) | 4 (12.1) | 3 (10.0) | ||
| 1–2 times a month | 9 (16.1) | 3 (9.4) | 6 (25.0) | 3 (4.8) | 1 (3.0) | 2 (6.7) | ||
| 1–2 times a week | 14 (25.0) | 7 (21.9) | 7 (29.2) | 15 (23.8) | 4 (12.1) | 11 (36.7) | ||
| Almost every day | 22 (39.3) | 14 (43.8) | 8 (33.3) | 33 (52.4) | 22 (66.7) | 11 (36.7) | ||
| Several times a day | 4 (7.1) | 2 (6.3) | 2 (8.3) | 5 (7.9) | 2 (6.1) | 3 (10.0) | ||
| Meal preparation ability | 0.398 | 0.071 | ||||||
| Not difficult at all | 26 (46.4) | 14 (43.8) | 12 (50.0) | 35 (55.6) | 23 (69.7) | 12 (40.0) | ||
| Slightly difficult | 15 (26.8) | 8 (25.0) | 7 (29.2) | 20 (31.7) | 8 (24.2) | 12 (40.0) | ||
| Fairly difficult | 8 (14.3) | 7 (21.9) | 1 (4.2) | 7 (11.1) | 2 (6.1) | 5 (16.7) | ||
| Almost unable | 5 (8.9) | 2 (6.3) | 3 (12.5) | 1 (1.6) | 0 (0.0) | 1 (3.3) | ||
| Completely unable | 2 (3.6) | 1 (3.1) | 1 (4.2) | 0 (0.0) | 0 (0.0) | 0 (0.0) | ||
| Number of chronic diseases | 0.259 | 0.718 | ||||||
| None | 11 (19.6) | 8 (25.0) | 3 (12.5) | 3 (4.8) | 1 (3.0) | 2 (6.7) | ||
| 1 chronic disease | 16 (28.6) | 9 (28.1) | 7 (29.2) | 18 (28.6) | 8 (24.2) | 10 (33.3) | ||
| 2 chronic disease | 12 (21.4) | 4 (12.5) | 8 (33.3) | 13 (20.6) | 7 (21.2) | 6 (20.0) | ||
| 3 or more chronic diseases | 17 (30.4) | 11 (34.4) | 6 (25.0) | 29 (46.0) | 17 (51.5) | 12 (40.0) | ||
| Height (cm) | 165.6 ± 5.6 | 165.0 ± 6.6 | 166.4 ± 3.7 | 0.405 | 154.0 ± 5.6 | 152.8 ± 6.3 | 155.3 ± 4.6 | 0.085 |
| Weight (kg) | 64.9 ± 7.4 | 64.4 ± 8.9 | 65.5 ± 4.8 | 0.435 | 54.2 ± 9.3 | 53.2 ± 7.0 | 55.3 ± 11.4 | 0.490 |
| BMI (kg/m2) |
0.730 | 0.110 | ||||||
| Underweight | 1 (1.8) | 1 (3.1) | 0 (0.0) | 6 (9.5) | 2 (6.1) | 4 (13.3) | ||
| Normal | 23 (41.1) | 13 (40.6) | 10 (31.3) | 27 (42.9) | 13 (39.4) | 14 (46.7) | ||
| Pre-obese | 17 (30.4) | 10 (31.3) | 7 (29.2) | 17 (27.0) | 13 (39.4) | 4 (13.3) | ||
| Obese Class I | 13 (23.2) | 6 (18.8) | 7 (29.2) | 11 (17.5) | 5 (15.2) | 6 (20.0) | ||
| Obese Class II | 2 (3.6) | 2 (6.3) | 0 (0.0) | 2 (3.2) | 0 (0.0) | 2 (6.7) | ||
| Obese Class III | 0 (0.0) | 0 (0.0) | 0 (0.0) | 0 (0.0) | 0 (0.0) | 0 (0.0) | ||
| Variable | Total (n = 56) | Men | P-value |
Total (n = 63) | Women | P-value |
||
|---|---|---|---|---|---|---|---|---|
| Users (n = 32) | Non-users (n = 24) | Users (n = 33) | Non-users (n = 30) | |||||
| INQ |
||||||||
| Protein (g) | 1.3 ± 0.3 | 1.3 ± 0.4 | 1.2 ± 0.3 | 0.655 | 1.1 ± 0.3 | 1.2 ± 0.2 | 1.1 ± 0.3 | 0.165 |
| Ca (mg) | 1.0 ± 0.4 | 1.1 ± 0.4 | 0.9 ± 0.4 | 0.132 | 0.7 ± 0.3 | 0.7 ± 0.4 | 0.6 ± 0.3 | 0.536 |
| P (mg) | 1.8 ± 0.4 | 1.8 ± 0.4 | 1.9 ± 0.3 | 0.529 | 1.4 ± 0.3 | 1.4 ± 0.2 | 1.3 ± 0.4 | 0.322 |
| Fe (mg) | 2.1 ± 1.7 | 2.0 ± 0.8 | 2.1 ± 2.5 | 0.055 | 1.6 ± 0.5 | 1.7 ± 0.6 | 1.4 ± 0.4 | 0.074 |
| Zn (mg) | 0.9 ± 0.3 | 0.9 ± 0.3 | 0.9 ± 0.3 | 0.817 | 0.9 ± 0.3 | 1.0 ± 0.3 | 0.8 ± 0.4 | 0.012 |
| Vitamin A (μg RAE) | 0.8 ± 0.7 | 0.9 ± 0.9 | 0.6 ± 0.5 | 0.180 | 0.7 ± 0.6 | 0.9 ± 0.7 | 0.5 ± 0.4 | < 0.001 |
| Vitamin B1 (mg) | 1.3 ± 0.4 | 1.3 ± 0.4 | 1.2 ± 0.3 | 0.037 | 1.3 ± 0.5 | 1.4 ± 0.5 | 1.2 ± 0.5 | 0.296 |
| Vitamin B2 (mg) | 1.1 ± 0.5 | 1.2 ± 0.6 | 1.0 ± 0.3 | 0.024 | 1.1 ± 0.3 | 1.2 ± 0.3 | 1.0 ± 0.4 | 0.019 |
| Vitamin B6 (mg) | 0.3 ± 0.3 | 0.3 ± 0.3 | 0.3 ± 0.3 | 0.791 | 0.2 ± 0.2 | 0.2 ± 0.2 | 0.2 ± 0.2 | 0.231 |
| Vitamin B12 (μg) | 1.5 ± 1.2 | 1.5 ± 1.4 | 1.4 ± 1.0 | 0.631 | 1.2 ± 1.8 | 0.8 ± 0.5 | 1.5 ± 2.5 | 0.308 |
| Niacin (NE) (mg) | 1.0 ± 0.4 | 0.9 ± 0.4 | 1.1 ± 0.3 | 0.059 | 0.9 ± 0.3 | 0.9 ± 0.4 | 0.8 ± 0.3 | 0.052 |
| Vitamin C (mg) | 1.2 ± 2.0 | 1.3 ± 2.3 | 1.1 ± 1.7 | 0.132 | 0.9 ± 0.9 | 0.9 ± 0.9 | 0.8 ± 1.0 | 0.104 |
| Folate (DFE) (μg) | 1.0 ± 0.6 | 1.1 ± 0.7 | 1.0 ± 0.5 | 0.631 | 0.8 ± 0.4 | 0.9 ± 0.4 | 0.7 ± 0.3 | 0.032 |
| MAR |
0.7 ± 0.2 | 0.8 ± 0.2 | 0.6 ± 0.2 | < 0.001 | 0.6 ± 0.2 | 0.7 ± 0.2 | 0.5 ± 0.2 | < 0.001 |
| Variable | Total (n = 56) | Men | P-value |
Total (n = 63) | Women | P-value |
||
|---|---|---|---|---|---|---|---|---|
| Users (n = 32) | Non-users (n = 24) | Users (n = 33) | Non-users (n = 30) | |||||
| NQ-E score | ||||||||
| Nutrition Index | 53.9 ± 15.2 | 50.2 ± 14.5 | 58.9 ± 14.9 | 0.051 | 56.2 ± 13.5 | 59.3 ± 12.0 | 52.8 ± 14.4 | 0.107 |
| Balance | 47.8 ± 20.2 | 44.0 ± 19.0 | 53.0 ± 20.9 | 0.143 | 52.3 ± 17.5 | 55.9 ± 17.6 | 48.4 ± 16.9 | 0.132 |
| Moderation | 53.3 ± 37.2 | 45.7 ± 37.2 | 63.3 ± 35.3 | 0.098 | 61.2 ± 33.3 | 54.1 ± 32.0 | 69.0 ± 33.4 | 0.162 |
| Practice | 63.7 ± 18.1 | 61.3 ± 21.3 | 66.8 ± 12.5 | 0.337 | 60.9 ± 16.7 | 66.0 ± 16.4 | 55.2 ± 15.5 | 0.016 |
| NQ-E score (level) | 0.354 | 0.590 | ||||||
| High | 22 (39.3) | 10 (31.3) | 12 (50.0) | 29 (46.0) | 17 (51.5) | 12 (40.0) | ||
| Medium | 21 (37.5) | 13 (40.6) | 8 (33.3) | 22 (34.9) | 11 (33.3) | 11 (36.7) | ||
| Low | 13 (23.2) | 9 (28.1) | 4 (16.7) | 12 (19.0) | 5 (15.2) | 7 (23.3) | ||
| Balance score (level) | 0.615 | 0.242 | ||||||
| High | 21 (37.5) | 12 (37.5) | 9 (37.5) | 28 (44.4) | 18 (54.5) | 10 (33.3) | ||
| Medium | 20 (35.7) | 10 (31.3) | 10 (41.7) | 25 (39.7) | 11 (33.3) | 14 (46.7) | ||
| Low | 15 (26.8) | 10 (31.3) | 5 (20.8) | 10 (15.9) | 4 (12.1) | 6 (20.0) | ||
| Moderation score (level) | 0.329 | 0.141 | ||||||
| High | 23 (41.1) | 11 (34.4) | 12 (50.0) | 28 (44.4) | 11 (33.3) | 17 (56.7) | ||
| Medium | 13 (23.2) | 7 (21.9) | 6 (25.0) | 26 (41.3) | 17 (51.5) | 9 (30.0) | ||
| Low | 20 (35.7) | 14 (43.8) | 6 (25.0) | 9 (14.3) | 5 (15.2) | 4 (13.3) | ||
| Practice score (level) | 0.243 | 0.030 | ||||||
| High | 21 (37.5) | 11 (34.4) | 10 (41.7) | 15 (23.8) | 12 (36.4) | 3 (10.0) | ||
| Medium | 19 (33.9) | 9 (28.1) | 10 (41.7) | 24 (38.1) | 12 (36.4) | 12 (40.0) | ||
| Low | 16 (28.6) | 12 (37.5) | 4 (16.7) | 24 (38.1) | 9 (27.3) | 15 (50.0) | ||
| Variable | B (unstandardized) | SE | β (standardized) | t | P-value | |
|---|---|---|---|---|---|---|
| Men | (Intercept) | 45.059 | 22.649 | - | 1.990 | 0.052 |
| Use of free meal service | –11.170 | 3.948 | –0.368 | –2.829 | 0.007 | |
| Adjusted R2 = 0.390, F = 5.389 | ||||||
| Women | (Intercept) | 37.161 | 25.796 | - | 1.441 | 0.155 |
| Use of free meal service | 1.323 | 3.657 | 0.05 | 0.362 | 0.719 | |
| Adjusted R2 = 0.220, F = 3.180 | ||||||
| Variable | B (unstandardized) | SE | β (standardized) | t | P-value | |
|---|---|---|---|---|---|---|
| Men | (Intercept) | 0.736 | 0.209 | - | 3.525 | < 0.001 |
| Use of free meal service | 0.064 | 0.036 | 0.180 | 1.757 | 0.085 | |
| Adjusted R2 = 0.623, F = 12.364 | ||||||
| Women | (Intercept) | 0.696 | 0.277 | - | 2.513 | 0.015 |
| Use of free meal service | 0.105 | 0.039 | 0.251 | 2.684 | 0.010 | |
| Adjusted R2 = 0.635, F = 14.468 | ||||||
| Variable | Total (n = 56) | Men | P-value1) | Total (n = 63) | Women | P-value1) | ||
|---|---|---|---|---|---|---|---|---|
| Users (n = 32) | Non-users (n = 24) | Users (n = 33) | Non-users (n = 30) | |||||
| Perceived health status | 0.179 | 0.017 | ||||||
| Very poor | 5 (8.9) | 4 (12.5) | 1 (4.2) | 3 (4.8) | 0 (0.0) | 3 (10.0) | ||
| Poor | 10 (17.9) | 7 (21.9) | 3 (12.5) | 21 (33.3) | 10 (30.3) | 11 (36.7) | ||
| Fair | 15 (26.8) | 6 (18.8) | 9 (37.5) | 18 (28.6) | 9 (27.3) | 9 (30.0) | ||
| Good | 19 (33.9) | 9 (28.1) | 10 (41.7) | 13 (20.6) | 6 (18.2) | 7 (23.3) | ||
| Very good | 7 (12.5) | 6 (18.8) | 1 (4.2) | 8 (12.7) | 8 (24.2) | 0 (0.0) | ||
| Perceived nutritional status | 0.330 | 0.031 | ||||||
| Very poor | 1 (1.8) | 1 (3.1) | 0 (0.0) | 2 (3.2) | 1 (3.0) | 1 (3.3) | ||
| Poor | 4 (7.1) | 4 (12.5) | 0 (0.0) | 14 (22.2) | 3 (9.1) | 11 (36.7) | ||
| Fair | 28 (50.0) | 14 (43.8) | 14 (58.3) | 30 (47.6) | 16 (48.5) | 14 (46.7) | ||
| Good | 17 (30.4) | 9 (28.1) | 8 (33.3) | 10 (15.9) | 7 (21.2) | 3 (10.0) | ||
| Very good | 6 (10.7) | 4 (12.5) | 2 (8.3) | 7 (11.1) | 6 (18.2) | 1 (3.3) | ||
| Perceived economic factors | 0.041 | 0.013 | ||||||
| Not at all influential | 16 (28.6) | 10 (31.3) | 6 (25.0) | 13 (20.6) | 11 (33.3) | 2 (6.7) | ||
| Hardly influential | 13 (23.2) | 3 (9.4) | 10 (41.7) | 6 (9.5) | 1 (3.0) | 5 (16.7) | ||
| Neutral | 12 (21.4) | 7 (21.9) | 5 (20.8) | 20 (31.7) | 8 (24.2) | 12 (40.0) | ||
| Influential | 13 (23.2) | 10 (31.3) | 3 (12.5) | 17 (27.0) | 11 (33.3) | 6 (20.0) | ||
| Very influential | 2 (3.6) | 2 (6.3) | 0 (0.0) | 7 (11.1) | 2 (6.1) | 5 (16.7) | ||
| Perceived social factors | 0.084 | 0.121 | ||||||
| Not at all influential | 29 (51.8) | 16 (50.0) | 13 (54.2) | 32 (50.8) | 21 (63.6) | 11 (36.7) | ||
| Hardly influential | 14 (25.0) | 5 (15.6) | 9 (37.5) | 7 (11.1) | 2 (6.1) | 5 (16.7) | ||
| Neutral | 6 (10.7) | 4 (12.5) | 2 (8.3) | 11 (17.5) | 5 (15.2) | 6 (20.0) | ||
| Influential | 5 (8.9) | 5 (15.6) | 0 (0.0) | 10 (15.9) | 5 (15.2) | 5 (16.7) | ||
| Very influential | 2 (3.6) | 2 (6.3) | 0 (0.0) | 3 (4.8) | 0 (0.0) | 3 (10.0) | ||
| Perceived physical factors | 0.349 | 0.117 | ||||||
| Not at all influential | 24 (42.9) | 14 (43.8) | 10 (41.7) | 24 (38.1) | 17 (51.5) | 7 (23.3) | ||
| Hardly influential | 8 (14.3) | 4 (12.5) | 4 (16.7) | 6 (9.5) | 4 (12.1) | 2 (6.7) | ||
| Neutral | 11 (19.6) | 4 (12.5) | 7 (29.2) | 10 (15.9) | 4 (12.1) | 6 (20.0) | ||
| Influential | 11 (19.6) | 8 (25.0) | 3 (12.5) | 18 (28.6) | 6 (18.2) | 12 (40.0) | ||
| Very influential | 2 (3.6) | 2 (6.3) | 0 (0.0) | 5 (7.9) | 2 (6.1) | 3 (10.0) | ||
Table 1. General and physical characteristics of study participants
n (%) or Mean ± SD. BMI, body mass index. Obesity classification: underweight (< 18.5 kg/m2), normal (18.5–22.9 kg/m2), pre-obesity (23.0–24.9 kg/m2), obesity class I (25.0–29.9 kg/m2), obesity class II (30.0–34.9 kg/m2), and obesity class III (≥ 35 kg/m2).
Table 2. Nutritional quality indices (INQ, MAR) from 24-hour dietary recall
Mean ± SD. INQ, index of nutritional quality; MAR, mean adequacy ratio; μg RAE, μg retinol activity equivalent; NE, niacin equivalent; DFE, dietary folate equivalent. INQ was calculated as the ratio of nutrient intake per 1,000 kcal to the recommended intake per 1,000 kcal. Nutrient adequacy ratio (NAR) was calculated by dividing nutrient intake by the recommended intake, with values restricted to 1. MAR represents the mean NAR across 13 nutrients: protein, calcium, phosphorus, iron, zinc, vitamin A, vitamin B1, vitamin B2, vitamin B6, vitamin B12, niacin, vitamin C, and folate.
Table 3. Total and subdomain scores and levels of the NQ-E
Mean ± SD or n (%). NQ-E, Nutrition Quotient for the Elderly.
Table 4. Multiple linear regression of the NQ-E in relation to free meal service use
NQ-E, Nutrition Quotient for the Elderly; B, unstandardized coefficient; SE, standard error; β, standardized coefficient; t, t-statistic testing. The model was adjusted for age, education level (ref.: rarely/never attended school), energy intake, food security status (ref.: sufficient quantity and variety), breakfast frequency (ref.: 5–7 days/week), contact frequency (ref.: rarely/almost never), and physical difficulty (ref.: none/no effect on eating).
Table 5. Multiple linear regression of the MAR in relation to free meal service use
MAR, mean adequacy ratio; B, unstandardized coefficient; SE, standard error; β, standardized coefficient; t, t-statistic testing. The model was adjusted for age, education level (ref.: rarely/never attended school), energy intake, food security status (ref.: sufficient quantity and variety), breakfast frequency (ref.: 5–7 days/week), contact frequency (ref.: rarely/almost never), and physical difficulty (ref.: none/no effect on eating).
Table 6. Perceived health, nutrition, and diet-related factors by free meal service use
n (%).


