
Articles
- Page Path
- HOME > Korean J Community Nutr > Volume 18(1); 2013 > Article
-
Original Article
- Nutritional Evaluation and Its Relation to the Risk of Metabolic Syndrome according to the Consumption of Cooked Rice and Cooked Rice with Multi-grains in Korean Adults: Based on 2007-2008 Korean National Health and Nutrition Examination Survey
- Soo-Hyun Son, Hwa-Jung Lee, Kyong Park, Tae-Youl Ha, Jung-Sook Seo
-
Korean Journal of Community Nutrition 2013;18(1):77-87.
DOI: https://doi.org/10.5720/kjcn.2013.18.1.77
Published online: February 28, 2013
Department of Food & Nutrition, Yeungnam University, Gyeongsan, Korea.
1Department of Statistics, Yeungnam University, Gyeongsan, Korea.
2Korea Food Research Institute, Gyeonggi, Korea.
- Corresponding author: Jung-Sook Seo, Department of Food and Nutrition, Yeungnam University, Gyeongsan 712-749, Korea. Tel: (053) 810-2875, Fax: (053) 810-4768, jsseo@ynu.ac.kr
• Received: January 7, 2013 • Revised: February 15, 2013 • Accepted: February 25, 2013
Copyright © 2013 The Korean Society of Community Nutrition
- 2,221 Views
- 4 Download
- 15 Crossref
Abstract
- This study was conducted to investigate the nutrient intakes of subjects by quartile of percent energy intake from cooked rice, consumption of cooked rice mixed with multi-grains and to evaluate rice consumption in relation to the risk of metabolic syndrome. The subjects were 5,830 males and females aged between 20~64 years based on 2007-2008 KNHNES data. Levels of percent energy intake from cooked rice were classified into 4 groups (Q1, Q2, Q3, Q4 groups: 25% of each) using data of 24-hour recall method from KNHNES. Using medical examination and questionnaire, subjects were classified according to diagnostic criteria of metabolic syndrome. The subjects with higher age, being married, lower education, lower economic level were more likely to take higher percent energy intake from cooked rice. Quartile Q3 of percent energy intake from cooked rice tended to show higher Index of Nutritional Quality (INQ) for fiber, calcium, iron, potassium and vitamin A. INQ of protein, dietary fiber, calcium, thiamin, phosphorus, potassium, riboflavin, niacin and vitamin C by consumption of cooked rice mixed with multi-grains was higher than that by consumption of cooked white rice when adjusted for age. No association with a risk for metabolic syndrome was found for quartile of percent energy intake from cooked rice or cooked rice mixed with multi-grains compared to cooked white rice after adjusting for energy, gender, age, BMI, alcohol, smoking, income and physical activity. In conclusion, consumption of over 54% energy intake from cooked rice or only cooked white rice showed relatively low INQs, but was not associated with a higher risk for metabolic syndrome.
-
This research was supported by iPET (Korea Institute of Planning and Evaluation for Technology in Food, Agricultural, Forestry and Fisheries), Ministry for Food, Agriculture, Forestry and Fisheries, Republic of Korea.
NOTES
- 1. Ahn JY, Ha TY. Nutritional superiority of rice. Food Preserv Process Ind. 2010; 9(2): 60-62.
- 2. Baxter AJ, Coyne T, McClintock C. Dietary patterns and metabolic syndrome - a review of epidemiologic evidence. Asia Pac J Clin Nutr. 2006; 15(2): 134-142.PubMed
- 3. Bland JM, Altman DG. Multiple significance tests: the Bonferroni method. BMJ. 1995; 310(6973): 170.ArticlePubMedPMC
- 4. Cha HM. A study on the trend analysis regarding the riceconsumption of Korean. 2010; Woosong University; 96-106 MS thesis.
- 5. Eckel RH, Grundy SM, Zimmet PZ. The metabolic syndrome. Lancet. 2005; 365: 1415-1428.ArticlePubMed
- 6. Flint AJ, Hu FB, Glynn RJ, Jensen MK, Franz M, Sampson L, Rimm EB. Whole grains and incident hypertension in men. Am J Clin Nutr. 2009; 90(3): 493-498.ArticlePubMedPMC
- 7. Grundy SM, Cleeman JI, Daniels SR, Donato KA, Eckel RH, Franklin BA, Gordon DJ, Krauss RM, Savage PJ, Smith SC Jr, Spertus JA, Costa F. Diagnosis and management of the metabolic syndrome. An American Heart Association/National Heart, Lung, and Blood Institute Scientific Statement. Executive summary. Cardiol Rev. 2005; 13(6): 322-327.PubMed
- 8. Hansen RG, Wyse BW. Expression of nutrient allowances per 1,000kilocalories. J Am Diet Assoc. 1980; 76(3): 223-227.ArticlePubMed
- 9. Hur IY, Moon HK. A study on the menu patterns of residents in Kangbukgu - Compared by the sex, age and health risk. Korean J Community Nutr. 2001; 6(5): 809-818.
- 10. Janssen I, Katzmarzyk PT, Ross R. Waist circumference and not body mass index explains obesity-related health risk. Am J Clin Nutr. 2004; 79(3): 379-384.ArticlePubMed
- 11. Jeong KH, Seo JH, Jeong YJ. Characteristics of soybean hydrolysates prepared with various protease. Korean J Food Preserv. 2005; 12(5): 460-464.
- 12. Jung HJ, Song WO, Paik H-Y, Joung H. Dietary characteristics of macronutrient intake and the status of metabolic syndrome among Koreans. Korean J Nutr. 2011; 44(2): 119-130.Article
- 13. Kang JH, Kim KA, Han JS. Korean diet and obesity. J Korean Soc Study Obes. 2004; 13(1): 34-41.
- 14. Kang M, Joung H, Lim JH, Lee YS, Song YJ. Secular trend in dietary patterns in a Korean adult population, using the 1998, 2001, and 2005 Korean national health and nutrition examination survey. Korean J Nutr. 2011; 44(2): 152-161.Article
- 15. Kim J, Jo I. Grains, vegetables, and fish dietary pattern is inversely associated with the risk of metabolic syndrome in South Korean adults. J Am Diet Assoc. 2011; 111: 1141-1149.ArticlePubMed
- 16. Kim J, Jo I, Joung H. A rice-based traditional dietary pattern is associated with obesity in Korean adults. J Acad Nutr Diet. 2012; 112: 246-253.ArticlePubMed
- 17. Kim YO. Changes in health status with the changing patterns of rice consumption among Korean. Food Ind Nutr. 2008; 13(2): 15-21.
- 18. Korea Centers for Disease Control and Prevention. Korea Health Statistics 2011: Korea National Health and Nutrition Examination Survey (KNHANES V-2). 2012; 384-386.
- 19. Korea Health Industry Development Institute. National Food & Nutrition Statistics: based on 2008 Korea National Health and Nutrition Examination Survey I. 2010.
- 20. Kwon Y. A trend analysis regarding the consumption, energy and macronutrient intakes according to the eating out frequency of the adults. 2009; Sangmyung University; MS thesis.
- 21. Lee HJ, Kim YA, Lee HS. Annual changes in the estimated dietary fiber intake of Korean during 1991-2001. Korean J Nutr. 2006; 39(6): 549-559.
- 22. Lee MJ, Popkin BM, Kim S. The unique aspect of the nutrition transition in South Korea: the retention of healthfulelements in their traditional diet. Public Health Nutr. 2002; 5(1A): 197-203.ArticlePubMed
- 23. Lee S. Association of whole grain consumption with socio-demographic and eating behavior factors in a Korea population: Based on 2007-2008 Korea National Health and Nutrition Examination Survey. Korean J Community Nutr. 2011; 16(3): 353-363.Article
- 24. Lee SY. A study of the preference and the consumption pattern for rice foods of university students. 2009; Graduate School of Education, Daejin University; MS thesis.
- 25. Lim BO, Lee CJ, Kim JD. Study on immunoregulatory function of dietary fiber. Food Ind Nutr. 2004; 9(2): 26-30.
- 26. Liu S, Stampfer MJ, Hu FB, Giovanncci E, Rimm E, Manson JE, Hennekens CH, Willett WC. Whole-grain consumption and risk of coronary heart disease: result from the Nurses Health Study. Am J Clin Nutr. 1999; 70(3): 412-429.PubMed
- 27. Ministry of Health and Welfare, Korea Centers for Disease Control and Prevention. The fourth Korea National Health and Nutrition Examination Survey (KNHANES IV). 2008.
- 28. National Cholesterol Education Program, National Heart, Lung, and Blood Institute, National Institute of Health. Third report panel on detection, evaluation, and treatment of high blood cholesterol in adults (Adult treatment panel III) final report. Circulation. 2002; 106(25): 3143.ArticlePubMed
- 29. Park S, Park MS, Ko JA. The association between carbohydrate intake and waist circumference. Korean J Obes. 2008; 17(4): 175-181.
- 30. Park SH, Lee KS, Park HY. Dietary carbohydrate intake is associated with cardiovascular disease risk in Korean: Analysis of the third Korea National Health and nutrition Examination Survey (KNHANES III). Int J Cardiol. 2010; 139: 234-240.ArticlePubMed
- 31. Randall E, Niohaman MZ, Contant CF. Diet diversity and nutrient intake. J Am Diet Assoc. 1985; 85(7): 830-836.ArticlePubMed
- 32. Rumawas ME, Meigs JB, Dwyer JT, McKeown NM, Jacques PF. Mediterranean-style dietary pattern, reduced risk of metabolic syndrome traits, and incidence in the Framingham Offspring Cohort. Am J Clin Nutr. 2009; 90: 1608-1614.ArticlePubMedPMC
- 33. Ryu HK. A comparative study on the nutrient content of rice-based and wheat-based meals in Miryang and Daegu. Korean J Community Living Sci. 2003; 14(3): 31-42.
- 34. Ryu SH, Jeon YS, Moon JW, Lee YS, Moon GS. Effect of kimchi ingredients to reactive oxygen species in skin cell cytotoxicity. J Korean Soc Food Sci Nutr. 1997; 26(6): 998-1005.
- 35. Ryu SH, Moon GS. Antioxidative and antiaging effects of dietary yellow and black soybean in rats. J Korean Soc Food Sci Nutr. 2003; 32(4): 591-597.Article
- 36. Seo JS, Cho SH. Rice-based traditional meal and prevention of chronic diseases. Food Ind Nutr. 2008; 13(2): 27-33.
- 37. Sluijs I, van der Schouw YT, van der A DL, Spijkerman AM, Hu FB, Grobbee DE, Beulens JW. Carbohydrate quantity and qualtity and risk of type 2 diabetes in the European prospective investigation into cancer and nutrition-Netherlands (EPIC-NL) study. Am J Clin Nutr. 2010; 92: 905-911.PubMed
- 38. Song SJ, Lee JE, Paik H-Y, Park MS, Song YJ. Dietary pattern based on carbohydrate nutrition are associated with the risk for diabetes and dyslipidemia. Nutr Res Pract. 2012; 6(4): 349-356.ArticlePubMedPMC
- 39. Song Y, Joung H. A traditional Korean dietary pattern and metabolic syndrome abnormalities. Nutr Metab Cardiovasc Dis. 2012; 22: 456-462.ArticlePubMed
- 40. Statistics Korea. Household food grain consumption per capita in 2010. 2011.
- 41. Sun Q, Spiegelman D, van Dam RM, Holmes MD, Malik VS, Willett WC, Hu FB. White rice, brown rice, and risk of type 2 diabetes in US men and women. Arch Intern Med. 2010; 170(11): 961-969.ArticlePubMedPMC
- 42. Yang EJ, Chung HK, Kim WY, Kerver JM, Song WO. Carbohydrate intake is associated with diet quality and risk factors for cardiovascular disease in U.S. adults: NHANES III. J Am Coll Nutr. 2003; 22(1): 71-79.ArticlePubMed
REFERENCES
Table 1General characteristics of the subjects by quartile of percent energy intake from cooked rice in KNHANES (2007~2008)
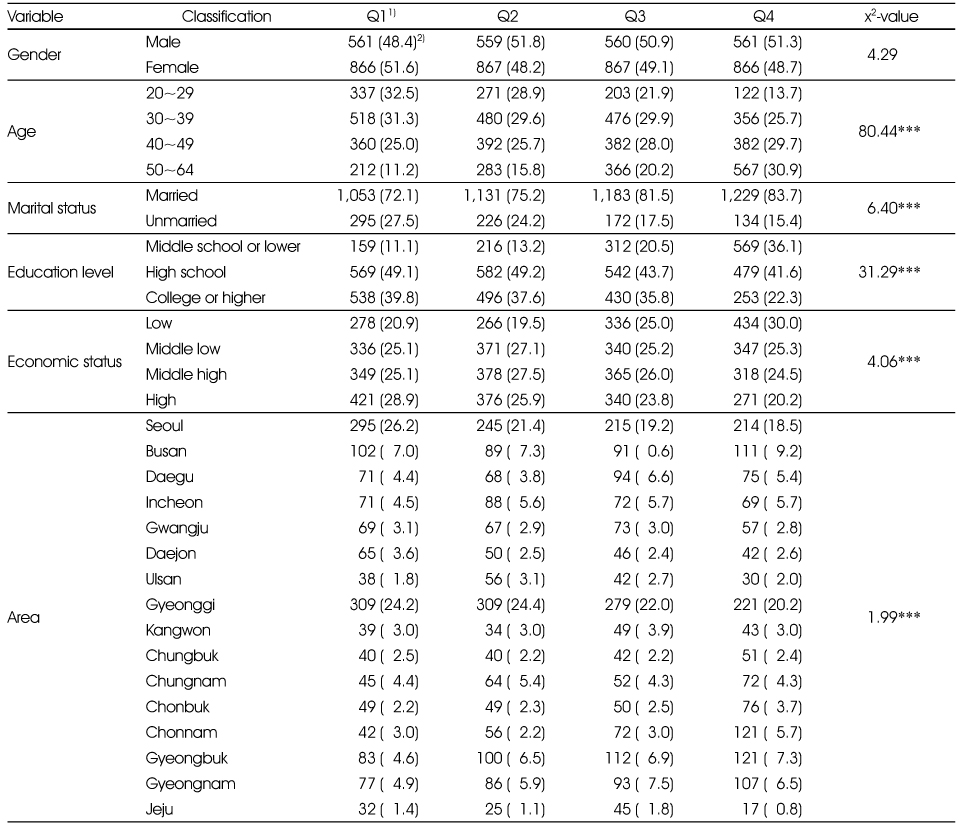
Table 2Mean daily INQ1) of the total subjects by quartile of percent energy intake from cooked rice in KNHANES (2007~2008)2)
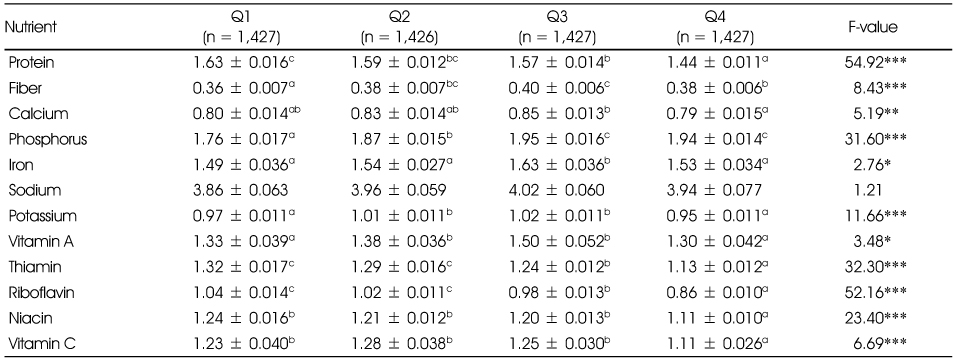
Table 3Mean daily INQ1) of male and female subjects by quartile of percent energy intake from cooked rice in KNHANES (2007~2008)2)
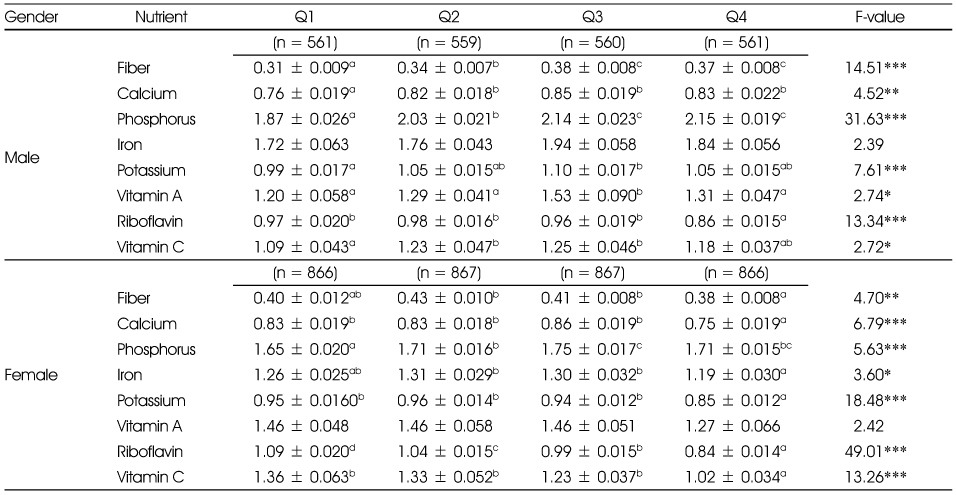
Table 4Mean daily INQ1) of the total subjects by consumption of cooked rice mixed with multi-grains in KNHANES (2007~2008)2)
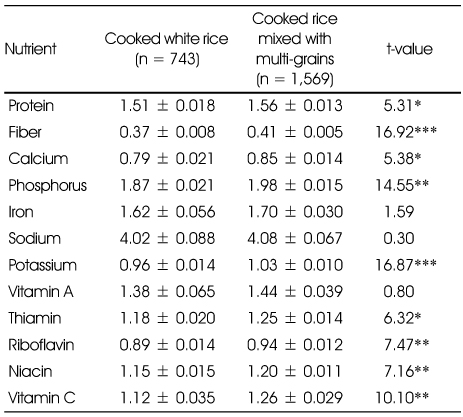
Table 5Mean daily INQ1) of age group by consumption of cooked rice mixed with multi-grains in KNHANES (2007~2008)
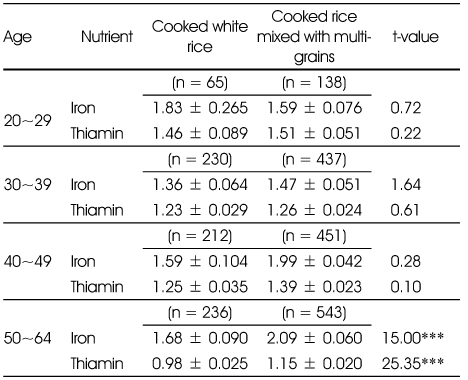
Table 6Odds ratio and 95% CI for metabolic syndrome and metabolic risk factors by quartile of percent energy intake from cooked rice in KNHANES (2007~2008)
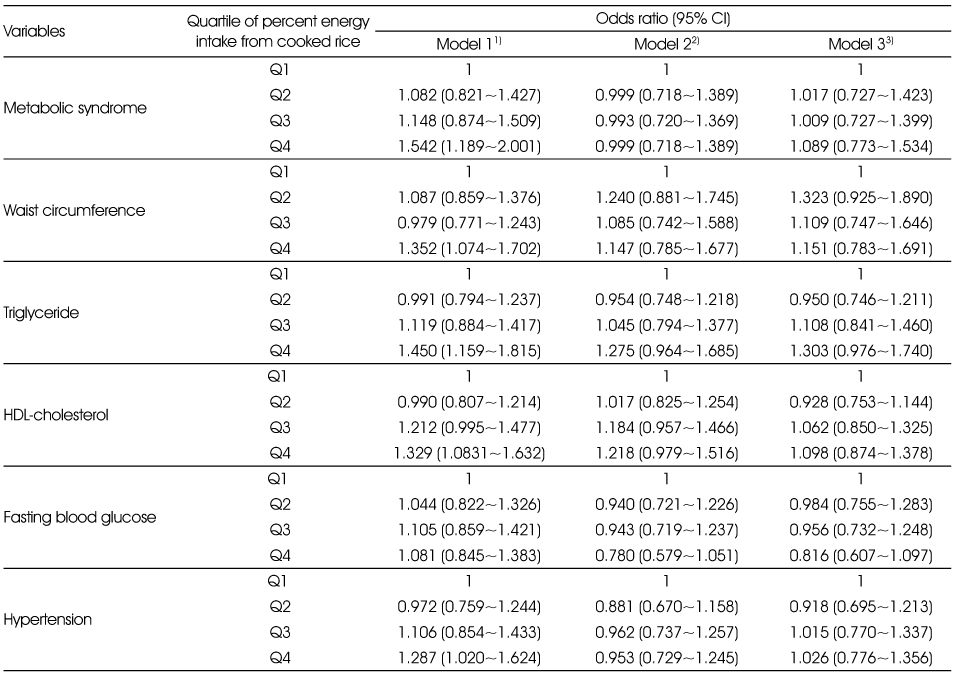
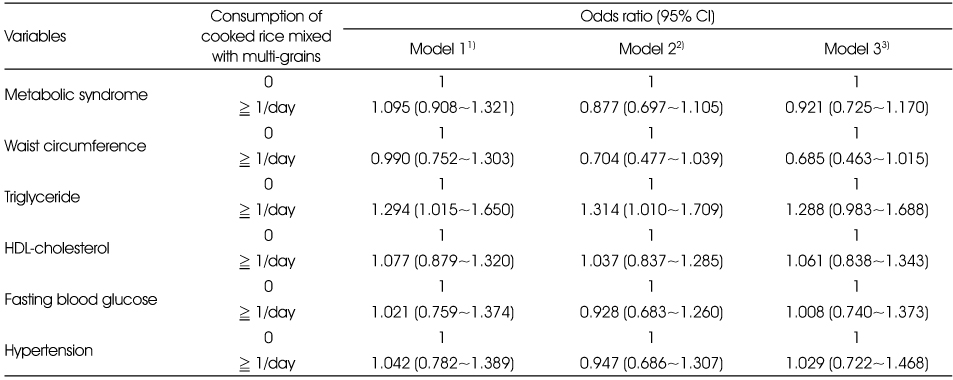
Figure & Data
REFERENCES
Citations
Citations to this article as recorded by 
- Dietary patterns and diet quality among adults in their 20s according to rice consumption: a co-occurrence network analysis using the Korea National Health and Nutrition Examination Survey (KNHANES) 2019–2021
Eun-kyung Kim, Jin-Young Lee, Yong-Seok Kwon, Minji Kang
Journal of Nutrition and Health.2025; 58(6): 571. CrossRef - Associations of Whole Grain and Refined Grain Consumption With Metabolic Syndrome. A Meta-Analysis of Observational Studies
Hongbin Guo, Jun Ding, Jieyu Liang, Yi Zhang
Frontiers in Nutrition.2021;[Epub] CrossRef - Association of Korean fermented cabbage kimchi consumption with an incidence of metabolic syndrome: 10-year follow-up results of the Korean Genome and Epidemiology Study
Suk Hyeon Seo, Jiyoun Hong, Im Huei Son, Young Hee Han, Taisun Hyun
Journal of Nutrition and Health.2019; 52(6): 569. CrossRef - Dietary quality differs by consumption of meals prepared at home vs. outside in Korean adults
Kyung Won Lee, Won O. Song, Mi Sook Cho
Nutrition Research and Practice.2016; 10(3): 294. CrossRef - Diet Pattern According to Socio-Economic status - Using the Fifth (2010-2012) Korea National Health and Nutrition Examination Survey
Han Na Kim, Hyo Eun Park
The International Journal of Advanced Culture Technology.2016; 4(3): 24. CrossRef - Evaluation of Obesity and Nutritional Status by Age among Low-income Women aged over 20 -Using Data from the Fourth Korea National Health and Nutrition Examination Survey-
Hee-Kyung Jang
Journal of the East Asian Society of Dietary Life.2015; 25(2): 246. CrossRef - The Development of Institutional Food-Service Menu with Temple Food
Sim-Yeol Lee, Jin-A Kim
Korean Journal of Community Nutrition.2015; 20(5): 338. CrossRef - Adequate Standard Pot and Number of Plants Per Tree of Raising Seeding Pot on the Foxtail Millet Transplanting Culture in the Southern Province
Yong-Soon Kim, Dong-Kwan Kim, Jin-Gyung Choi, Heung-Gyu Park, Myeong-Seok Kim, Hae-Ryoung Shin, Gyung-Ju Choi, Jong-Tag Yun
The Korean Journal of Crop Science.2015; 60(1): 23. CrossRef - Analysis of Dietary Intake Status and Risk of Metabolic Syndrome According to White Rice Consumption in Korea: Basted on Data 1st (1998), 4th (2007~2009), 6th (2013) Korean National Health and Nutrition Examination Survey (KNHANES)
Fang-Fang Song, Jin-A Jang, Yang-suk Kim, Hei-ryeo Yoon, Mi-Sook Cho
Journal of The Korean Society of Food Culture.2015; 30(5): 682. CrossRef - The Effect on Behavior of Instant Rice Selected Attributes According to Food Lifestyle
Inja Youn, Sohyeong Myeong, Deokihn Yoon
Journal of The Korean Society of Food Culture.2015; 30(6): 804. CrossRef - The Relationship between Health Behavior and General Health Status: Based on 2011 Korea National Health and Nutrition Examination Survey
Chunhoo Cheon, So-Mi Oh, Soobin Jang, Jeong-Su Park, Sunju Park, Bo-Hyoung Jang, Yong-Cheol Shin, Seong-Gyu Ko
Osong Public Health and Research Perspectives.2014; 5(1): 28. CrossRef - An Evaluation of Dietary Habit and Nutritional Status by Household Income in Female Adults over the Age of 20 - Using Data from the Fourth Korea National Health and Nutrition Examination Survey -
Hee-Kyung Jang
The Korean Journal of Food And Nutrition.2014; 27(4): 660. CrossRef - The Risk of Metabolic Syndrome by Dietary Patterns of Middle-aged Adults in Gyeonggi Province
You-Sin Lee, Moo-Yong Lee, Sim-Yeol Lee
Korean Journal of Community Nutrition.2014; 19(6): 527. CrossRef - Cooking Properties and Antioxidant Activity of Cooked Rice According to the Addition of Glutinous and Non-glutinous Sorghum
Koan Sik Woo, Jee Yeon Ko, Jung In Kim, Jae Saeng Lee, Seuk Bo Song, Jae Min Cho, Tae Wook Jung, Ki Young Kim, In Seok Oh
Korean Journal of Crop Science.2013; 58(4): 399. CrossRef - Nutritional Assessment and Perioperative Nutritional Support in Gastric Cancer Patients
Kyung Won Seo, Ki Young Yoon
The Korean Journal of Gastroenterology.2013; 61(4): 186. CrossRef
 Cite
Cite- We recommend
- Related articles
-
- Changing patterns and related factors of kimchi consumption among Korean adults: a nationwide cross-sectional analysis of the Korea National Health and Nutrition Examination Survey, 2010–2024
- Association between nutrient intake and frailty status in Korean older adults: a cross-sectional study using the 9th (2022–2023) Korea National Health and Nutrition Examination Survey
- Self-reported weight change and diet quality in relation to metabolic syndrome among Korean cancer survivors: a cross-sectional study using the Korea National Health and Nutrition Examination Survey 2019–2021
Nutritional Evaluation and Its Relation to the Risk of Metabolic Syndrome according to the Consumption of Cooked Rice and Cooked Rice with Multi-grains in Korean Adults: Based on 2007-2008 Korean National Health and Nutrition Examination Survey
Nutritional Evaluation and Its Relation to the Risk of Metabolic Syndrome according to the Consumption of Cooked Rice and Cooked Rice with Multi-grains in Korean Adults: Based on 2007-2008 Korean National Health and Nutrition Examination Survey
General characteristics of the subjects by quartile of percent energy intake from cooked rice in KNHANES (2007~2008)
1) Quartile of percent energy intake from cooked rice
2) N (%)
***: p < 0.001
Mean daily INQ1) of the total subjects by quartile of percent energy intake from cooked rice in KNHANES (2007~2008)2)
1) INQ: Index of Nutritional Quality
2) Age-adjusted results
Values with different letter within the row are significantly different by Bonferroni method (p < 0.05)
*: p < 0.05, **: p < 0.01, ***: p < 0.001
Mean daily INQ1) of male and female subjects by quartile of percent energy intake from cooked rice in KNHANES (2007~2008)2)
1) INQ: Index of Nutritional Quality
2) Age-adjusted results
Values with different letter within the row are significantly different by Bonferroni method (p < 0.05)
*: p < 0.05, **: p < 0.01, ***: p < 0.001
Mean daily INQ1) of the total subjects by consumption of cooked rice mixed with multi-grains in KNHANES (2007~2008)2)
1) INQ: Index of Nutritional Quality
2) Age-adjusted results
*: p < 0.05, **: p < 0.01, ***: p < 0.001
Mean daily INQ1) of age group by consumption of cooked rice mixed with multi-grains in KNHANES (2007~2008)
1) INQ: Index of Nutritional Quality
***: p < 0.001
Odds ratio and 95% CI for metabolic syndrome and metabolic risk factors by quartile of percent energy intake from cooked rice in KNHANES (2007~2008)
1) Model 1: Crude
2) Model 2: Adjusted for age, energy, sex, BMI
3) Model 3: Adjusted for age, energy, sex, BMI, alcohol, smoke, income, activity
Odds ratio and 95% CI for metabolic syndrome and metabolic risk factors by consumption of cooked rice mixed with multi-grains in KNHANES (2007~2008)
1) Model 1: Crude
2) Model 2: Adjusted for age, energy, sex, BMI
3) Model 3: Adjusted for age, energy, sex, BMI, alcohol, smoke, income, activity
Table 1
General characteristics of the subjects by quartile of percent energy intake from cooked rice in KNHANES (2007~2008)
1) Quartile of percent energy intake from cooked rice 2) N (%) ***: p < 0.001
Table 2
Mean daily INQ1) of the total subjects by quartile of percent energy intake from cooked rice in KNHANES (2007~2008)2)
1) INQ: Index of Nutritional Quality 2) Age-adjusted results Values with different letter within the row are significantly different by Bonferroni method (p < 0.05) *: p < 0.05, **: p < 0.01, ***: p < 0.001
Table 3
Mean daily INQ1) of male and female subjects by quartile of percent energy intake from cooked rice in KNHANES (2007~2008)2)
1) INQ: Index of Nutritional Quality 2) Age-adjusted results Values with different letter within the row are significantly different by Bonferroni method (p < 0.05) *: p < 0.05, **: p < 0.01, ***: p < 0.001
Table 4
Mean daily INQ1) of the total subjects by consumption of cooked rice mixed with multi-grains in KNHANES (2007~2008)2)
1) INQ: Index of Nutritional Quality 2) Age-adjusted results *: p < 0.05, **: p < 0.01, ***: p < 0.001
Table 5
Mean daily INQ1) of age group by consumption of cooked rice mixed with multi-grains in KNHANES (2007~2008)
1) INQ: Index of Nutritional Quality ***: p < 0.001
Table 6
Odds ratio and 95% CI for metabolic syndrome and metabolic risk factors by quartile of percent energy intake from cooked rice in KNHANES (2007~2008)
1) Model 1: Crude 2) Model 2: Adjusted for age, energy, sex, BMI 3) Model 3: Adjusted for age, energy, sex, BMI, alcohol, smoke, income, activity
Table 7
Odds ratio and 95% CI for metabolic syndrome and metabolic risk factors by consumption of cooked rice mixed with multi-grains in KNHANES (2007~2008)
1) Model 1: Crude 2) Model 2: Adjusted for age, energy, sex, BMI 3) Model 3: Adjusted for age, energy, sex, BMI, alcohol, smoke, income, activity


