
Articles
- Page Path
- HOME > Korean J Community Nutr > Volume 19(4); 2014 > Article
-
Research Article
- Chinese Female Marriage Immigrants' Dietary Life after Immigration to Korea : Comparison between Han-Chinese and Korean-Chinese
- Kana Asano, Jihyun Yoon, Si-Hyun Ryu
-
Korean Journal of Community Nutrition 2014;19(4):317-327.
DOI: https://doi.org/10.5720/kjcn.2014.19.4.317
Published online: August 31, 2014
1Department of Food and Nutrition, Seoul National University, Seoul, Korea.
2Department of Nutrition and Foodswervice Management, Paichai University, Daejeon, Korea.
- Corresponding author: Si-Hyun Ryu. Department of Nutrition and Foodservice Management, Paichai University, 155-40 Baejae-ro, Seo-gu, Daejeon 302-735, Korea. Tel: (042) 520-5907, Fax: (070) 4369-1778, ryush@pcu.ac.kr
• Received: June 19, 2014 • Revised: August 12, 2014 • Accepted: August 26, 2014
Copyright © 2014 The Korean Society of Community Nutrition
This is an Open-Access article distributed under the terms of the Creative Commons Attribution Non-Commercial License (http://creativecommons.org/licenses/by-nc/3.0/) which permits unrestricted non-commercial use, distribution, and reproduction in any medium, provided the original work is properly cited.
- 2,224 Views
- 1 Download
- 17 Crossref
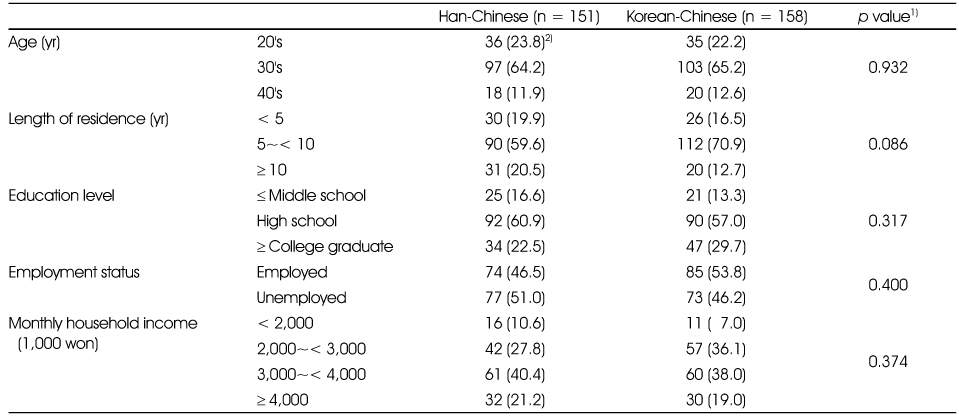
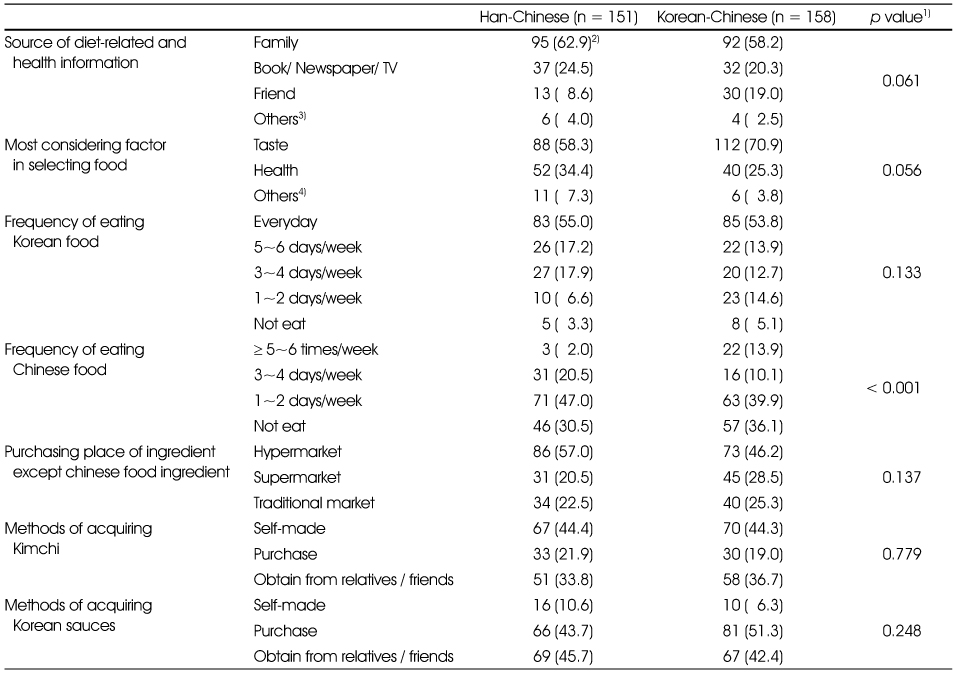
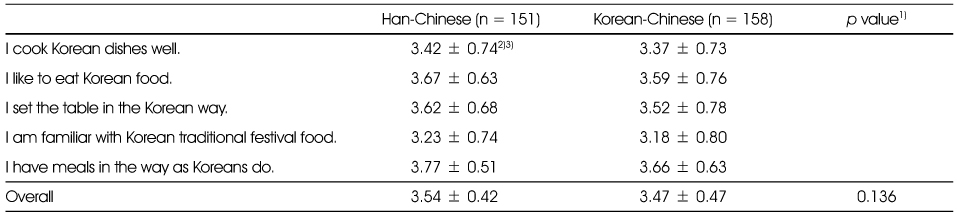
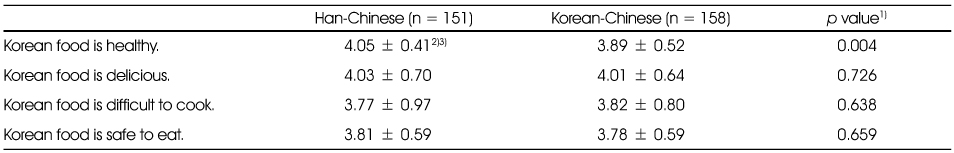

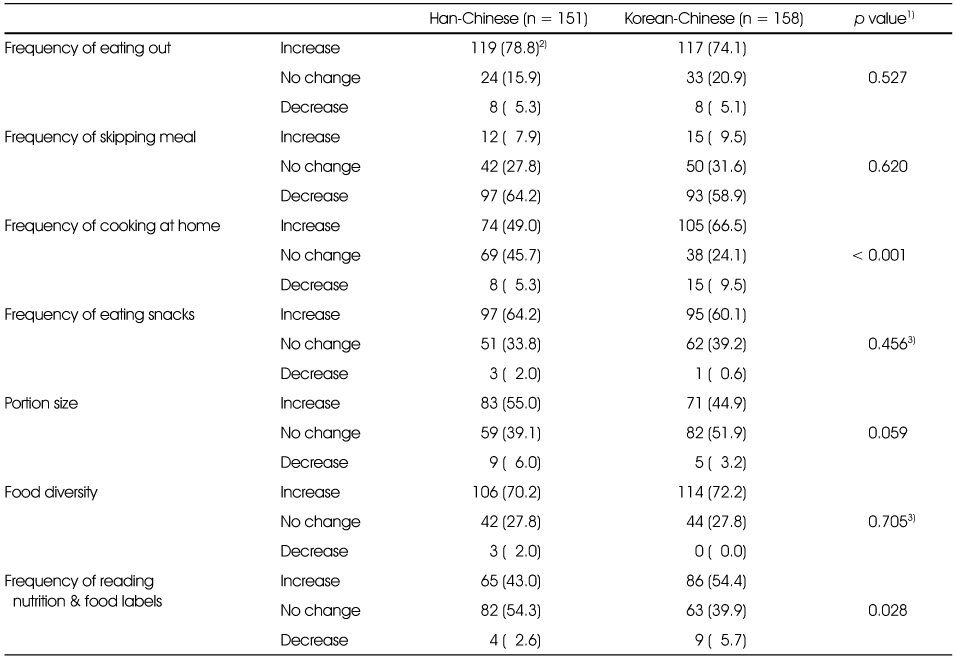
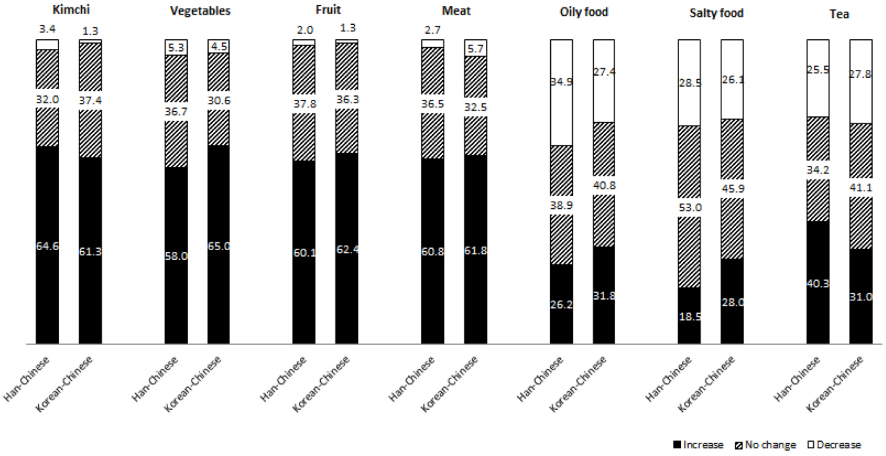
Figure & Data
REFERENCES
Citations
Citations to this article as recorded by 
- Dietary acculturation and changes of Central Asian immigrant workers in South Korea by health perception
EunJung Lee, Juyeon Kim
Journal of Nutrition and Health.2021; 54(3): 305. CrossRef - Flavor principle as an implicit frame: Its effect on the acceptance of instant noodles in a cross-cultural context
Meng Li, Seo-Jin Chung
Food Quality and Preference.2021; 93: 104293. CrossRef - Development and evaluation of semi-quantitative food frequency questionnaire for marriage migrant women in multicultural families
Jung-Hyun Kim, Oh Yoen Kim, Min June Lee, Eunju Park
Journal of Nutrition and Health.2021; 54(1): 76. CrossRef - Consumption of Han-sik and its Association with Socioeconomic Status among Filipino Immigrant Women: the Filipino Women's Diet and Health Study (FiLWHEL)
Nayeon Kim, Minji Kang, Grace Abris, Sherlyn Mae P. Provido, Hyojee Joung, Sangmo Hong, Sung Hoon Yu, Chang Beom Lee, Jung Eun Lee
Korean Journal of Community Nutrition.2018; 23(6): 475. CrossRef - Analysis of Korean Dietary Life Adaptation of Married Female Immigrants
Jeong-Sook Lee
Korean Journal of Community Nutrition.2017; 22(2): 103. CrossRef - Study on the change and acculturation of dietary pattern of Southeast Asian workers living in South Korea
Eun Jung Lee, Kyung-Ran Lee, Seung-Joo Lee
Appetite.2017; 117: 203. CrossRef - Development of a Korean Food Culture Education Textbook for Married Female Immigrants
Jeong-Sook Lee
Korean Journal of Community Nutrition.2016; 21(5): 415. CrossRef - Dietary behaviors of female marriage immigrants residing in Gwangju, Korea
Eun Ju Yang
Journal of Nutrition and Health.2016; 49(3): 179. CrossRef - Female Marriage Immigrants’ Information Awareness, Perception and Familiarity on Korean Food Culture by Personal Characteristics and Food Neophobia Degree
Hee-sun Jeong, Ji-young Yoon
Korean Journal of Food & Cookery Science.2016; 32(2): 233. CrossRef - Food intake and nutritional status of female marriage immigrants residing in Gwangju, Korea
Eun Ju Yang, Jin Mo Khil
Journal of Nutrition and Health.2016; 49(5): 358. CrossRef - Acculturation and changes in dietary behavior and anthropometric measures among Chinese international students in South Korea
Jounghee Lee, Ran-Ran Gao, Jung-Hee Kim
Nutrition Research and Practice.2015; 9(3): 304. CrossRef - Factors related to Korean Dietary Adaptation in Chinese Female Marriage Immigrants living in the Seoul Metropolitan Area
Kana Asano, Jihyun Yoon, Si-Hyun Ryu
Journal of the East Asian Society of Dietary Life.2015; 25(2): 234. CrossRef - Comparison of Eating Habits and Food Preference of Elementary School Children between Multi-cultural Families and Ordinary Families in Gyeongnam Province
Joo Hee Lee, Seon Ok Jeong, Changim Kim
The Korean Journal of Food And Nutrition.2015; 28(6): 973. CrossRef - A Comparative Study of Dietary and Weight Control Behavior of Female College Students in Korea and China
Li Song, Na Young An, Ho Kyung Ryu
The Korean Journal of Community Living Science.2015; 26(4): 761. CrossRef - Comparative Study on Dietary Life of Southeast Asian Workers Living in South Korea
Eun Jung Lee, Kyung-Ran Lee
Journal of The Korean Society of Food Culture.2015; 30(4): 422. CrossRef - Korean Food Acculturation Phenomena of Married Immigrant Women and Their Children’s Eating Habits
Jisun Lee, Solji Lee, Bokyung Ryu, Lana Chung
Journal of The Korean Society of Food Culture.2015; 30(5): 545. CrossRef - Japanese Female Marriage Immigrants' Dietary Life and Health-related Characteristics by Level of Dietary Adaptation after Immigration to Korea
kana Asano, Jihyun Yoon, Si-Hyun Ryu
Journal of the East Asian Society of Dietary Life.2015; 25(5): 765. CrossRef
 Cite
CiteChinese Female Marriage Immigrants' Dietary Life after Immigration to Korea : Comparison between Han-Chinese and Korean-Chinese
Chinese Female Marriage Immigrants' Dietary Life after Immigration to Korea : Comparison between Han-Chinese and Korean-Chinese
The general characteristics of the respondents
1) p-value by chi-square test
2) N (%)
The dietary practice of Chinese female marriage immigrants in Korea
1) p-value by chi-square test
2) N (%)
3) Community / Internet
4) Price / Korean-style
The dietary acculturation level of Chinese female marriage immigrants in Korea
1) p-value by chi-square test
2) 5 point scale: 1 = strongly disagree, 2 = disagree, 3 = neutral, 4 = agree, 5 = strongly agree
3) Mean ± SD
The perception on Korean food of Chinese female marriage immigrants in Korea
1) p-value by chi-square test
2) 5 point scale: 1 = strongly disagree, 2 = disagree, 3 = neutral, 4 = agree, 5 = strongly agree
3) Mean ± SD
The healthy dietary behavior of Chinese female marriage immigrants in Korea
1) p-value by chi-square test
2) 5 point scale: 1 = strongly disagree, 2 = disagree, 3 = neutral, 4 = agree, 5 = strongly agree
3) Mean ± SD
4) Reverse coding
Chinese female marriage immigrants' changes in dietary habits after immigration to Korea
1) p-value by chi-square test
2) N (%)
3) 33% of the cells had expected counts of less than 5. Therefore "no change" and "decrease" response categories were combined into a single category for chi-square test.
Chinese female marriage immigrants' change in food intake after immigration to Korea
Table 1
The general characteristics of the respondents
1) 2) N (%)
Table 2
The dietary practice of Chinese female marriage immigrants in Korea
1) 2) N (%) 3) Community / Internet 4) Price / Korean-style
Table 3
The dietary acculturation level of Chinese female marriage immigrants in Korea
1) 2) 5 point scale: 1 = strongly disagree, 2 = disagree, 3 = neutral, 4 = agree, 5 = strongly agree 3) Mean ± SD
Table 4
The perception on Korean food of Chinese female marriage immigrants in Korea
1) 2) 5 point scale: 1 = strongly disagree, 2 = disagree, 3 = neutral, 4 = agree, 5 = strongly agree 3) Mean ± SD
Table 5
The healthy dietary behavior of Chinese female marriage immigrants in Korea
1) 2) 5 point scale: 1 = strongly disagree, 2 = disagree, 3 = neutral, 4 = agree, 5 = strongly agree 3) Mean ± SD 4) Reverse coding
Table 6
Chinese female marriage immigrants' changes in dietary habits after immigration to Korea
1) 2) N (%) 3) 33% of the cells had expected counts of less than 5. Therefore "no change" and "decrease" response categories were combined into a single category for chi-square test.
Table 7
Chinese female marriage immigrants' change in food intake after immigration to Korea


