
Articles
- Page Path
- HOME > Korean J Community Nutr > Volume 16(3); 2011 > Article
-
Original Article
- Egg Consumption and Prevalence of Metabolic Syndrome in Korean Adults: Based on 2007-2008 Korean National Health and Nutrition Examination Survey
- Hyo-Jin Kim, Kyong Park
-
Korean Journal of Community Nutrition 2011;16(3):364-374.
DOI: https://doi.org/10.5720/kjcn.2011.16.3.364
Published online: June 30, 2011
Department of Food & Nutrition, Yeungnam University, Gyeongsan, Gyeongbuk, Korea.
- Corresponding author: Kyong Park, Department of Food & Nutrition, Yeungnam University, 214-1 Dae-dong, Gyeongsan, Gyeongbuk 712-749, Korea. Tel: (053) 810-2879, Fax: (053) 810-4768, kypark@ynu.ac.kr
• Received: May 4, 2011 • Revised: June 7, 2011 • Accepted: June 21, 2011
Copyright © 2011 The Korean Society of Community Nutrition
- 1,823 Views
- 0 Download
- 15 Crossref
Abstract
- There is a great public concern that higher consumption of eggs may increase the risk of chronic disease due to high levels of cholesterol in eggs. In contrast to this concern, limited studies have examined this relationship, and the study results have been inconsistent. This study was to evaluate the cross-sectional associations between egg consumption, blood markers and metabolic syndrome in Korean adults. We analyzed data from the combined 2007-2008 Korean National Health and Nutrition Examination Survey (KNHANES). Egg intakes were assessed using a food frequency questionnaire. Metabolic syndrome was ascertained using criteria of the NCEP ATP III (2001) and abdominal obesity criteria of the WHO. In 5,548 subjects, 937 subjects were defined as having metabolic syndrome. In linear regression models, subjects reporting one or more egg consumption per day had significantly lower levels of triglyceride, fasting blood glucose and blood pressure, and a higher level of HDL cholesterol, compared to those who rarely consumed eggs (P-trends < 0.05). After adjustments for potential confounding factors, the associations were no longer significant except for total cholesterol, showing higher levels with frequent egg consumption. More frequent intakes of egg (1 egg or more/day) were associated with lower risk of metabolic syndrome in a logistic regression model (OR: 0.69, 95% CI: 0.50-0.96), but this association also became insignificant after adjustments for multiple confounding factors (OR: 1.05, 95% CI: 0.71-1.57). In healthy Korean adults, frequent intakes of eggs did not adversely affect the risk of metabolic syndrome. Further studies are needed to confirm this finding.
- 1. Aune D, Ursin G, Veierød MB. Meat consumption and the risk of type 2 diabetes: a systematic review and meta-analysis of cohort studies. Diabetologia. 2009; 52(11): 2277-2287.ArticlePubMedPDF
- 2. Ballesteros MN, Cabrera RM, Saucedo Mdel S, Fernandez ML. Dietary cholesterol does not increase biomarkers for chronic disease in a pediatric population from northern Mexico. Am J Clin Nutr. 2004; 80(4): 855-861.ArticlePubMed
- 3. Bartov I, Reiser R, Henderson GR. Hypercholesterolemic effect in the female rat of egg yolk versus crystalline cholesterol dissolved in lard. J Nutr. 1973; 103(10): 1400-1405.ArticlePubMed
- 4. Chakrabarty G, Bijlani RL, Mahapatra SC, Mehta N, Lakshmy R, Vashisht S, Manchanda SC. The effect of ingestion of egg on serum lipid profile in healthy young free-living subjects. Indian J Physiol Pharmacol. 2002; 46(4): 492-498.PubMed
- 5. Dawber TR, Nickerson RJ, Brand FN, Pool J. Eggs, serum cholesterol, and coronary heart disease. Am J Clin Nutr. 1982; 36(4): 617-625.ArticlePubMed
- 6. Djousse L, Gaziano JM, Buring JE, Lee IM. Egg consumption and risk of type 2 diabetes in men and women. Diabetes Care. 2009; 32(2): 295-300.ArticlePubMedPMCPDF
- 7. Djousse L, Kamineni A, Nelson TL, Carnethon M, Mozaffarian D, Siscovick D, Mukamal KJ. Egg consumption and risk of type 2 diabetes in older adults. Am J Clin Nutr. 2010; 92(2): 422-427.ArticlePubMedPMC
- 8. Flynn MA, Heine B, Nolph GB, Naumann HD, Parisi E, Ball D, Krause G, Ellersieck M, Ward SS. Serum lipids in humans fed diets containing beef or fish and poultry. Am J Clin Nutr. 1981; 34(12): 2734-2741.ArticlePubMed
- 9. Flynn MA, Nolph GB, Flynn TC, Kahrs R, Krause G. Effect of dietary egg on human serum cholesterol and triglycerides. Am J Clin Nutr. 1979; 32(5): 1051-1057.ArticlePubMed
- 10. Ford ES. Risks for all-cause mortality, cardiovascular disease, and diabetes associated with the metabolic syndrome: a summary of the evidence. Diabetes Care. 2005; 28(7): 1769-1778.PubMed
- 11. Hegsted DM, McGandy RB, Myers ML, Stare FJ. Quantitative effects of dietary fat on serum cholesterol in man. Am J Clin Nutr. 1965; 17(5): 281-295.ArticlePubMed
- 12. Hopkins PN. Effects of dietary cholesterol on serum cholesterol: a meta-analysis and review. Am J Clin Nutr. 1992; 55(6): 1060-1070.ArticlePubMed
- 13. Keys A. Serum cholesterol response to dietary cholesterol. Am J Clin Nutr. 1984; 40(2): 351-359.ArticlePubMed
- 14. Korea Centers for Disease Control and Prevention. The Fourth Korea Health and Nutrition Examination Survey Manual (2007-2009). 2010.
- 15. Korea Centers for Disease Control and Prevention & Korea Health Industry Development Institute. In-Depth Analysis on the 3rd Korea Health and Nutrition Examination Survey: Nutrition Survey. 2007.
- 16. Mattson FH, Erickson BA, Kligman AM. Effect of dietary cholesterol on serum cholesterol in man. Am J Clin Nutr. 1972; 25(6): 589-594.ArticlePubMed
- 17. Porter MW, Yamanaka W, Carlson SD, Flynn MA. Effect of dietary egg on serum cholesterol and triglyceride of human males. Am J Clin Nutr. 1977; 30(4): 490-495.ArticlePubMed
- 18. Pyörälä K. Dietary cholesterol in relation to plasma cholesterol and coronary heart disease. Am J Clin Nutr. 1987; 45: 5 Suppl. 1176-1184.ArticlePubMed
- 19. Resnick HE, Jones K, Ruotolo G, Jain AK, Henderson J, Lu W, Howard BV. Strong Heart Study. Insulin resistance, the metabolic syndrome, and risk of incident cardiovascular disease in nondiabetic American indians: the Strong Heart Study. Diabetes Care. 2003; 26(3): 861-867.PubMed
- 20. Shi Z, Yuan B, Zhang C, Zhou M, Holmboe-Ottesen G. Egg consumption and the risk of diabetes in adults, Jiangsu, China. Nutrition. 2011; 27(2): 194-198.ArticlePubMed
- 21. Song Y, Manson JE, Buring JE, Liu S. A prospective study of red meat consumption and type 2 diabetes in middle-aged and elderly women: the women's health study. Diabetes Care. 2004; 27(9): 2108-2115.PubMed
- 22. Srilatha B, Adaikan PG, Ng SC, Aulkumaran S. Effects of feeding egg yolk on the serum lipid levels in rabbits. Methods Find Exp Clin Pharmacol. 1997; 19(7): 489-492.PubMed
- 23. van Dam RM, Rimm EB, Willett WC, Stampfer MJ, Hu FB. Dietary patterns and risk for type 2 diabetes mellitus in U.S. men. Ann Intern Med. 2002; 136(3): 201-209.ArticlePubMed
- 24. Weggemans RM, Zock PL, Katan MB. Dietary cholesterol from eggs increases the ratio of total cholesterol to high-density lipoprotein cholesterol in humans: a meta-analysis. Am J Clin Nutr. 2001; 73(5): 885-891.ArticlePubMed
REFERENCES
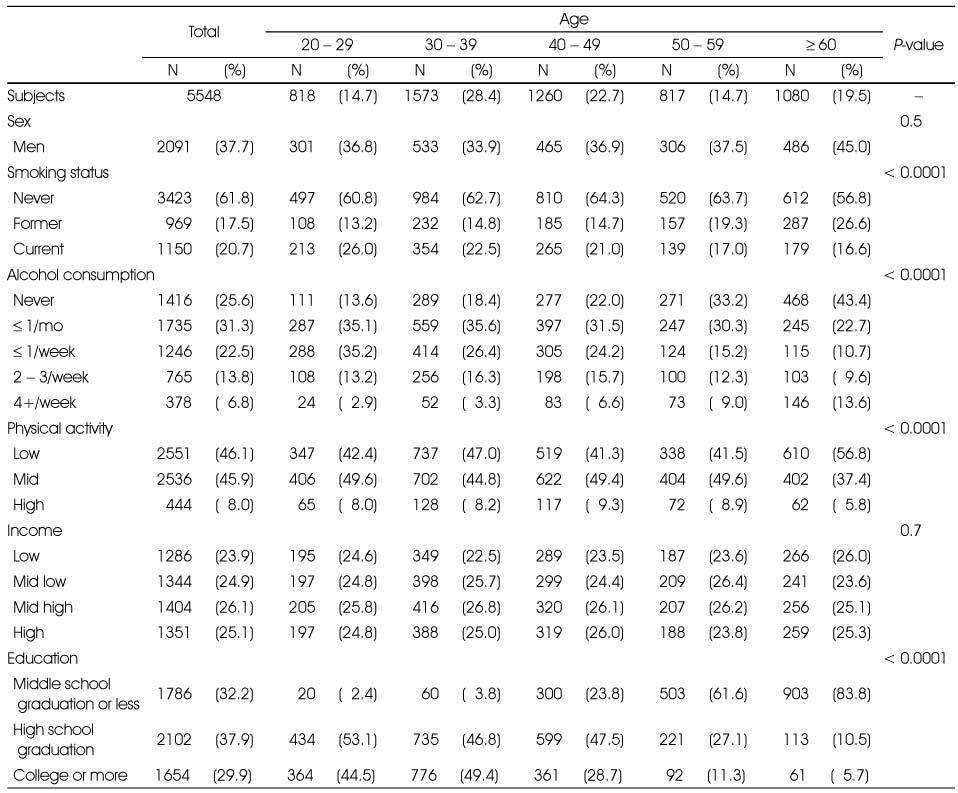
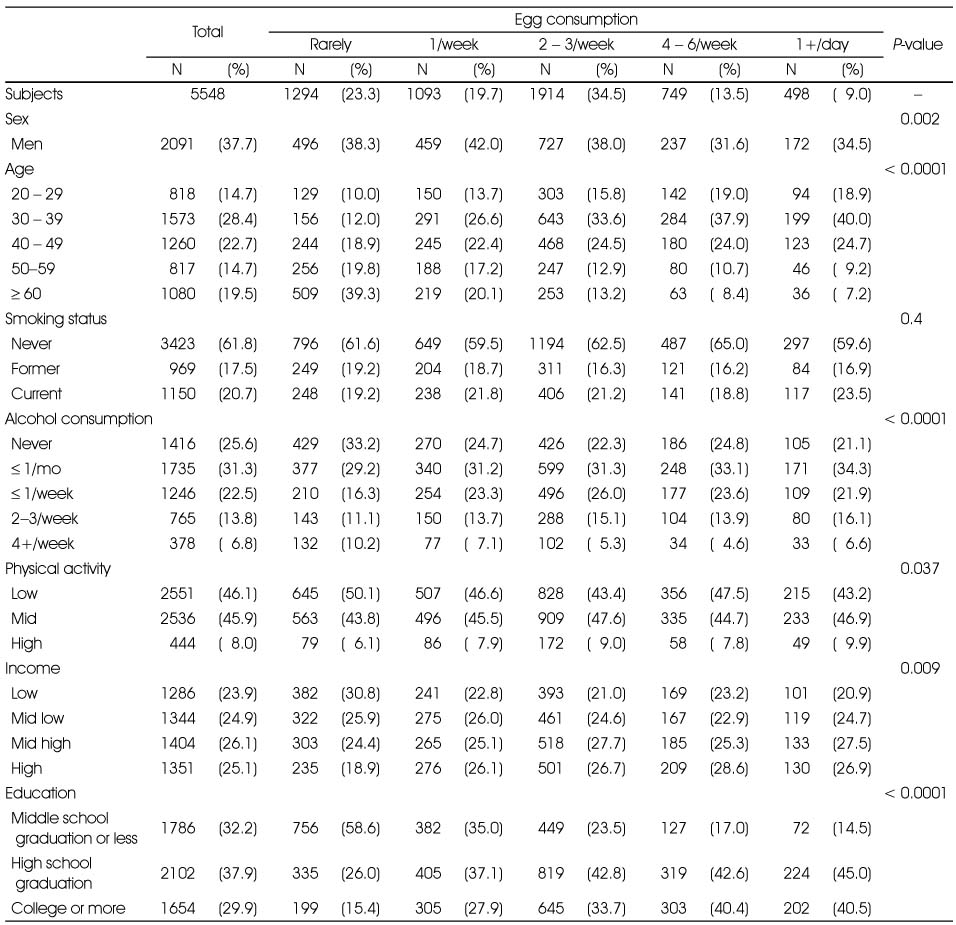
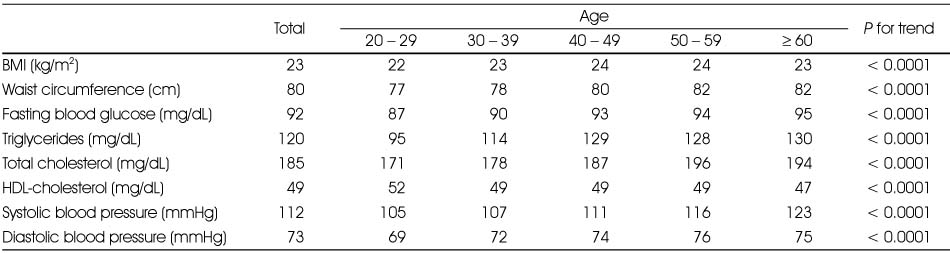
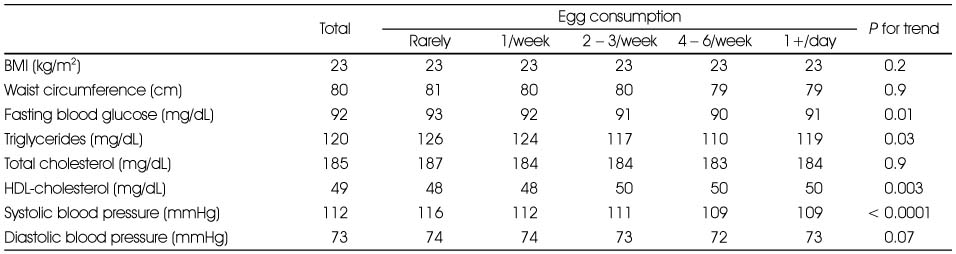
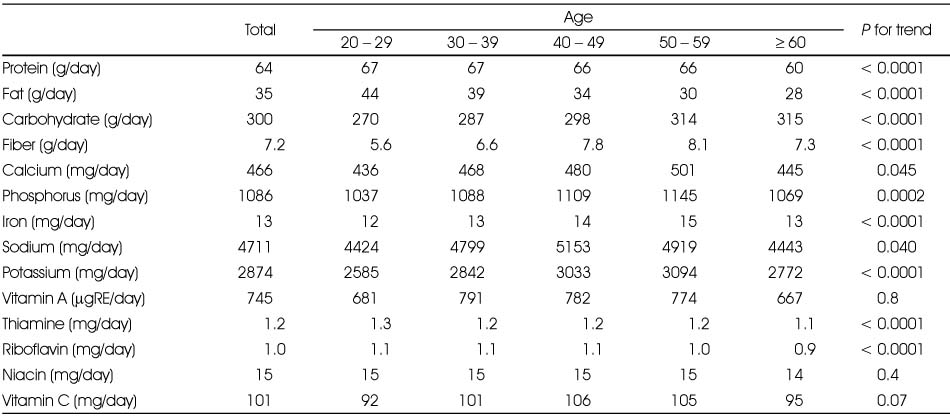
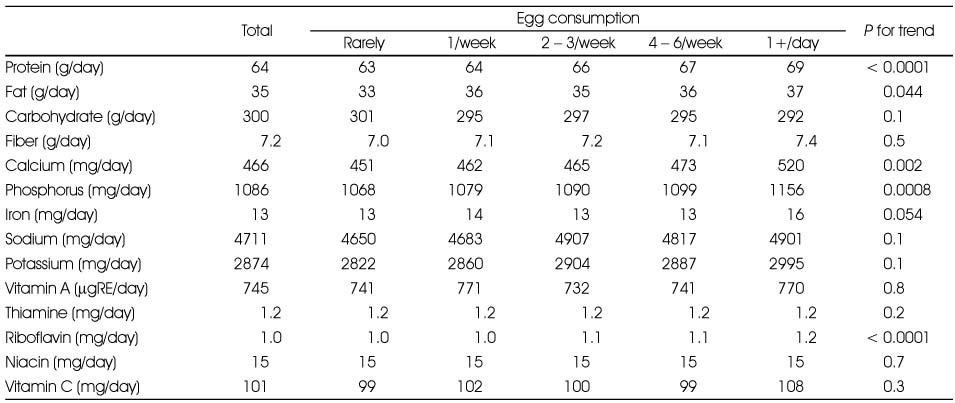
Table 4Relationship between frequency of egg consumption and metabolic bio-markers
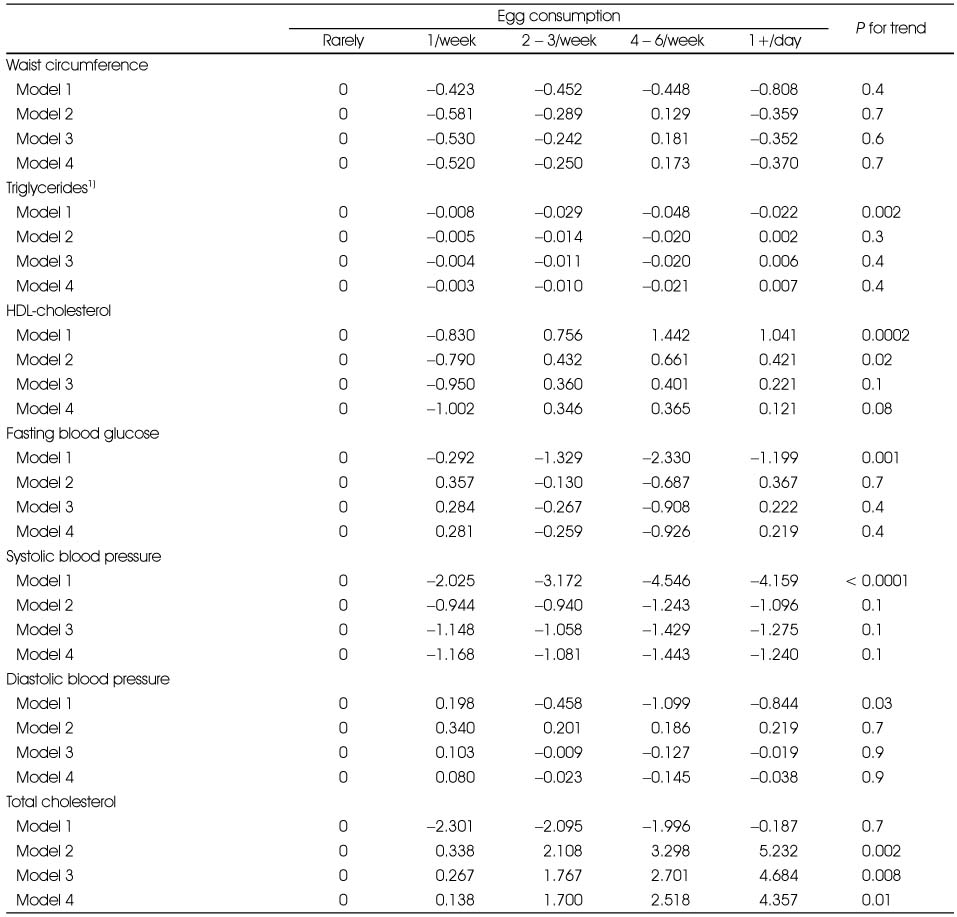
Data are β-coefficients
Model 1: Unadjusted model; Model 2: adjustment for age, sex, energy, and BMI; Model 3: Model 2 + additional adjustment for alcohol consumption (never, < = 1/mo, < = 1/wk, 2-3/wk, or 4+/wk), smoking status (never, former, or current), physical activity, and income (low, mid low, mid high, or high); Model 4: Model 3 + additional adjustment for protein (g/day), fat (g/day), carbohydrate (g/day), calcium (mg/day), phosphorus (mg/day), and riboflavin intakes (mg/day)
1) Triglycerides were logarithmically transformed for the purpose of analysis, and β-coefficients were presented in the log scale (% change of triglycerides)
Table 5Odds ratio (95% CI) for metabolic syndrome according to the frequency of egg consumption (N=5,548)
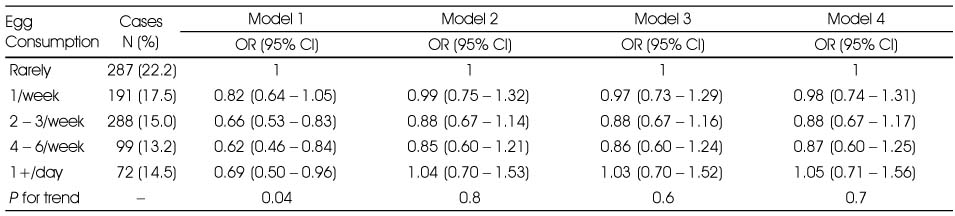
Model 1: Unadjusted model; Model 2: adjustment for age, sex, energy, and BMI; Model 3: Model 2 + additional adjustment for alcohol consumption (never, < = 1/mo, < = 1/wk, 2 . 3/wk, or 4+/wk), smoking status (never, former, or current), physical activity, and income (low, mid low, mid high, or high); Model 4: Model 3 + additional adjustment for protein (g/day), fat (g/day), carbohydrate (g/day), calcium (mg/day), phosphorus (mg/day), and riboflavin intakes (mg/day)
Figure & Data
REFERENCES
Citations
Citations to this article as recorded by 
- Association of High sensitivity C-reactive protein (Hs-CRP) with poor Glycaemic control and Coronary Heart Disease in Type 2 Diabetes Mellitus
dayoub Aziz, Imad Khayat Mohammad, Zrieki Afraa
Research Journal of Pharmacy and Technology.2023; : 193. CrossRef - Relationship between Egg Consumption and Metabolic Syndrome. A Meta-Analysis of Observational Studies
J. Ding, Yi Zhang
The Journal of nutrition, health and aging.2022; 26(4): 373. CrossRef - Relationship between Egg Consumption and Body Composition as Well as Serum Cholesterol Level: Korea National Health and Nutrition Examination Survey 2008–2011
Jung-Eun Shim, Young-Gyun Seo
Journal of Clinical Medicine.2021; 10(24): 5918. CrossRef - Food consumption frequency of Korean adults based on whether or not having chewing difficulty using 2013–2016 KNHANES by sex-stratified comparative analysis
Mi Jeong Kim
Nutrition Research and Practice.2020; 14(6): 637. CrossRef - Risk of metabolic syndrome in non-alcoholic fatty liver disease patients
Yahya Pasdar, Shima Moradi, Jalal Moludi, Mitra Darbandi, Parisa Niazi, Seyyed Mostafa Nachvak, Hadi Abdollahzad
Mediterranean Journal of Nutrition and Metabolism.2019; 12(4): 353. CrossRef - Analysis of Kimchi, vegetable and fruit consumption trends among Korean adults: data from the Korea National Health and Nutrition Examination Survey (1998-2012)
Eun-Kyung Kim, Ae-Wha Ha, Eun-Ok Choi, Se-Young Ju
Nutrition Research and Practice.2016; 10(2): 188. CrossRef - Utilization and Application to Increase Egg Dishes in Communal Food Service in Accordance to Dietician’s Awareness
Heon Ok Lee, Si Jin Seong, Sang Woo Beak, Jung Geun Park, Jong Jun Kim, Eun Zoo Kang, Ae Son Om
Korean Journal of Food & Cookery Science.2016; 32(5): 619. CrossRef - Evaluation of Obesity and Nutritional Status by Age among Low-income Women aged over 20 -Using Data from the Fourth Korea National Health and Nutrition Examination Survey-
Hee-Kyung Jang
Journal of the East Asian Society of Dietary Life.2015; 25(2): 246. CrossRef - A Study on the Kimchi Consumption of Korean Adults:Using Korea National Health and Nutrition Examination Survey (2010~2012)
Eun-Kyung Kim, Yoo-Kyung Park, Se-Young Ju, Eun-Ok Choi
Journal of The Korean Society of Food Culture.2015; 30(4): 406. CrossRef - Food Insecurity and Related Risk Factors in the Elderly: Korea National Health and Nutrition Examination Survey 2013 Data
Hye-Sang Lee
Journal of the Korean Dietetic Association.2015; 21(4): 308. CrossRef - Utilization of Korea National Health and Nutrition Examination Survey Database: Estimation of Tomato Consumption and the Risk of Metabolic Syndrome
Eunha Youn, Jean Kyung Paik, Bumsik Kim
Food Engineering Progress.2014; 18(2): 109. CrossRef - An Evaluation of Dietary Habit and Nutritional Status by Household Income in Female Adults over the Age of 20 - Using Data from the Fourth Korea National Health and Nutrition Examination Survey -
Hee-Kyung Jang
The Korean Journal of Food And Nutrition.2014; 27(4): 660. CrossRef - The Factors Influencing Health-Related Quality of Life in the Elderly: Focused on the General Characteristics, Health Habits, Mental Health, Chronic Diseases, and Nutrient Intake Status: Data from the Fifth Korea National Health and Nutrition Examination
Hye-Sang Lee
Korean Journal of Community Nutrition.2014; 19(5): 479. CrossRef - Prevalence of Osteoarthritis and Related Risk Factors in the Elderly: Data from the Fifth Korea National Health and Nutrition Examination Survey (KNHANES V), 2010~2012
Hye-Sang Lee
Journal of the Korean Dietetic Association.2014; 20(2): 99. CrossRef - Permeation Efficiency of Sea Tangle (Laminaria japonica) Extract into Egg Using Temperature Change Method and Pressure
Yeo-Jin Park, Dong-Ho Kim, Keum-Il Jang
Journal of the Korean Society of Food Science and Nutrition.2014; 43(4): 544. CrossRef
 Cite
Cite- We recommend
- Related articles
-
- Changing patterns and related factors of kimchi consumption among Korean adults: a nationwide cross-sectional analysis of the Korea National Health and Nutrition Examination Survey, 2010–2024
- Differences in lunch nutrient intake and nutritional adequacy among Korean older adults by meal site: a cross-sectional analysis of the 2018–2021 Korea National Health and Nutrition Examination Survey data
- Association between nutrient intake and frailty status in Korean older adults: a cross-sectional study using the 9th (2022–2023) Korea National Health and Nutrition Examination Survey
- Comparison of dietary behaviors and nutrient intake by gender and household type among older Koreans: a cross-sectional study using data from the 8th Korea National Health and Nutrition Examination Survey
- Ultra-processed food intake and dietary behaviors in Korean adolescents: a cross-sectional study based on the 2019–2023 Korea National Health and Nutrition Examination Survey
Egg Consumption and Prevalence of Metabolic Syndrome in Korean Adults: Based on 2007-2008 Korean National Health and Nutrition Examination Survey
Egg Consumption and Prevalence of Metabolic Syndrome in Korean Adults: Based on 2007-2008 Korean National Health and Nutrition Examination Survey
General characteristics of subjects by age
All P-values were derived by chi-square tests
General characteristics of subjects according to the frequency of egg consumption
All P-values were derived by chi-square tests
Metabolic bio-markers of subjects by age
Data are mean
Metabolic bio-markers of subjects according to the frequency of egg consumption
Data are mean
Nutrient intakes of subjects by age
All nutrients are presented as adjusted means for energy intake and sex
Nutrient intakes of subjects according to the frequency of egg consumption
All nutrients are presented as adjusted means for energy intake, age and sex
Relationship between frequency of egg consumption and metabolic bio-markers
Data are β-coefficients
Model 1: Unadjusted model; Model 2: adjustment for age, sex, energy, and BMI; Model 3: Model 2 + additional adjustment for alcohol consumption (never, < = 1/mo, < = 1/wk, 2-3/wk, or 4+/wk), smoking status (never, former, or current), physical activity, and income (low, mid low, mid high, or high); Model 4: Model 3 + additional adjustment for protein (g/day), fat (g/day), carbohydrate (g/day), calcium (mg/day), phosphorus (mg/day), and riboflavin intakes (mg/day)
1) Triglycerides were logarithmically transformed for the purpose of analysis, and β-coefficients were presented in the log scale (% change of triglycerides)
Odds ratio (95% CI) for metabolic syndrome according to the frequency of egg consumption (N=5,548)
Model 1: Unadjusted model; Model 2: adjustment for age, sex, energy, and BMI; Model 3: Model 2 + additional adjustment for alcohol consumption (never, < = 1/mo, < = 1/wk, 2 . 3/wk, or 4+/wk), smoking status (never, former, or current), physical activity, and income (low, mid low, mid high, or high); Model 4: Model 3 + additional adjustment for protein (g/day), fat (g/day), carbohydrate (g/day), calcium (mg/day), phosphorus (mg/day), and riboflavin intakes (mg/day)
Table 1-1
General characteristics of subjects by age
All
Table 1-2
General characteristics of subjects according to the frequency of egg consumption
All
Table 2-1
Metabolic bio-markers of subjects by age
Data are mean
Table 2-2
Metabolic bio-markers of subjects according to the frequency of egg consumption
Data are mean
Table 3-1
Nutrient intakes of subjects by age
All nutrients are presented as adjusted means for energy intake and sex
Table 3-2
Nutrient intakes of subjects according to the frequency of egg consumption
All nutrients are presented as adjusted means for energy intake, age and sex
Table 4
Relationship between frequency of egg consumption and metabolic bio-markers
Data are β-coefficients Model 1: Unadjusted model; Model 2: adjustment for age, sex, energy, and BMI; Model 3: Model 2 + additional adjustment for alcohol consumption (never, < = 1/mo, < = 1/wk, 2-3/wk, or 4+/wk), smoking status (never, former, or current), physical activity, and income (low, mid low, mid high, or high); Model 4: Model 3 + additional adjustment for protein (g/day), fat (g/day), carbohydrate (g/day), calcium (mg/day), phosphorus (mg/day), and riboflavin intakes (mg/day) 1) Triglycerides were logarithmically transformed for the purpose of analysis, and β-coefficients were presented in the log scale (% change of triglycerides)
Table 5
Odds ratio (95% CI) for metabolic syndrome according to the frequency of egg consumption (N=5,548)
Model 1: Unadjusted model; Model 2: adjustment for age, sex, energy, and BMI; Model 3: Model 2 + additional adjustment for alcohol consumption (never, < = 1/mo, < = 1/wk, 2 . 3/wk, or 4+/wk), smoking status (never, former, or current), physical activity, and income (low, mid low, mid high, or high); Model 4: Model 3 + additional adjustment for protein (g/day), fat (g/day), carbohydrate (g/day), calcium (mg/day), phosphorus (mg/day), and riboflavin intakes (mg/day)


