
Articles
- Page Path
- HOME > Korean J Community Nutr > Volume 16(6); 2011 > Article
-
Original Article
- Effects of Occasional Mid-Morning Snacks on Dietary Behaviors and School Life in Elementary School Students
- Eun-Ji Park, Yuri Kim, Yunsook Lim
-
Korean Journal of Community Nutrition 2011;16(6):661-671.
DOI: https://doi.org/10.5720/kjcn.2011.16.6.661
Published online: December 31, 2011
1Nutrition Education Major, Graduate School of Education, Kyung Hee University, Seoul, Korea.
2Department of Nutritional Science and Food Management, Ewha Womans University, Seoul, Korea.
3Department of Food and Nutrition, Kyung Hee University, Seoul, Korea.
- Corresponding author: Yunsook Lim, Department of Food and Nutrition, Kyung Hee University, Hoegi-dong, Dongdamun-gu, Seoul 130-701, Korea. Tel: (02) 961-0262, Fax: (02) 968-0260, ylim@khu.ac.kr
• Received: August 25, 2011 • Revised: September 30, 2011 • Accepted: November 7, 2011
Copyright © 2011 The Korean Society of Community Nutrition
- 1,662 Views
- 1 Download
Abstract
- The objective of this study was to investigate the effect of occasional mid-morning snacks (MMS) on dietary behaviors and school life among elementary students. The students, mothers, and teachers from two elementary schools in Seoul were selected. The schools have been provided a steamed sweet-potato or potato, or a piece of ricecake or cake with a pack of milk as MMS 3-4 times a month for more than 3 years. Most students were satisfied with the MMS. Mothers and teachers reported that their children or students were happier, more active, and more energetic in school with MMS. Furthermore, the students answered that they could drink milk better on the day when the school provided MMS. Many students felt that it was relevant to serve a simple menu at lunch time if they were served MMS. Also, students became more interested in school meals or foods with MMS. In addition, mothers who had jobs wanted more frequent MMS. The degree of satisfaction about MMS of the teachers was higher than that of students or mothers. Many teachers thought that their students drank milk better with MMS and further, that it made students to drink more milk on other days. In conclusion, MMS had positive effects on the dietary behavior and school life of elementary students. Therefore, it can be a good option for eliminating skipping breakfast because it provides more nutrition, makes students drink more milk, and allows students to enjoy school activities more.
- 1. An GS, Shin DS. A comparison of the food and nutrient intake of adolescents between urban areas and islands in South Kyungnam. Korean J Community Nutr. 2001; 6(3): 271-281.
- 2. Choe JS, Chun HK, Chung GJ, Nam HJ. Relations between the dietary habit and academic achievement, subjective health judgement, physical status of high school students. J Korean Soc Food Sci Nutr. 2003; 32(4): 627-635.Article
- 3. Kim BR, Kim YM. A study on the food habits and evaluation of nutrient intakes of high school students in Chunchoen. J Korean Home Econ Educ Assoc. 2005; 17(1): 35-52.
- 4. Kim MS. The nutrition education contents development regarding morning going without a meal of the elementary student. 2008; Konkuk University; 24-28 Dissertation.
- 5. Kim SH. Children's growth and school performance in relation to breakfast. J Korean Diet Assoc. 1999; 5(2): 215-224.
- 6. Kim TY, Kim HS. Comparison of calcium intake status among elementary students by participation in the school milk program. Korean J Food Cult. 2009; 24(1): 106-115.
- 7. Kim YH, Seo JS. Dietary pattern of children with an unbalanced diet in school feeding. J Korean Diet Assoc. 2004; 10(3): 345-355.
- 8. Kim YS, Yoon JH, Kim HR, Kwon SO. Factors affecting intention to participate in school breakfast programs of middle and high school students in Seoul. Korean J Community Nutr. 2007; 12(4): 489-500.
- 9. Lee KH, Hwang KJ, Her ES. A study on body image recognition, food habits, food behaviors and nutrient intake according to the obesity index of elementary children in Changwon. Korean J Community Nutr. 2001; 6(4): 577-591.
- 10. Lee PS, Lee MA, Yang IS, Cha SM. Assessing relative importance of perational factors for school breaksfast program using conjoint analysis. Korean J Food Cult. 2007; 22(5): 621-632.
- 11. Lee YS, Yim HS, Ahn HS, Chang NS. Nutrition throughout the life cycle. 2006; Seoul: Kyomunsa; 259-262.
- 12. Ministry of Health, Welfare and Family Affairs (MHWFA). 2005 Korea National Health and Nutrition Examination Survey. 2006.
- 13. Murphy JM, Pagano ME, Nachmani J, Sperling P, Kane S, Kelinman RE. The relationshiop of school breakfast to psychosocial and academic functioning: Cross-sectional and longitudinal observation in an inner-city school sample. Arch Pediatr Adolesc Med. 1998; 152(9): 899-907.ArticlePubMed
- 14. Oh YM, Kim MH, Sung CJ. The study of satisfaction, meal preference and improvement on school lunch program of middle school boys and girls in Jeonju. J Korean Diet Assoc. 2006; 12(4): 358-368.
- 15. Paik JJ, Lee HS. Dietary behaviors, food preferences and its relationships with personality traits in sixth grader's of elementary school. Korean J Community Nutr. 2004; 9(2): 135-141.
- 16. Sjoberg A, Hallberg L, Hoglund D, Hulthen L. Meal pattern, food choice, nutrient intake, and life factors in The Goteborg Adolescence Study. Eur J Clin Nutr. 2003; 57(12): 1569-1578.ArticlePubMedPDF
- 17. Yang IS. Enhancing the school foodservice management through national school breakfast program. J Korean Diet Assoc. 1997; 3(2): 223-238.
- 18. Yang IS, Yi BS, Park MK, Kim HY, Kim YS. Development of standardized manual for efficient management of school milk program. J Korean Home Econ Assoc. 2009; 47(5): 95-105.
- 19. Yeoh YJ, Yoon JH, Shim JE, Chung SJ. Factors associated with skipping breakfast in Korean children: analysis of data from the 2001 National Health and Nutrition Survey. Korean J Community Nutr. 2008; 13(1): 62-68.
- 20. Yoon JH, Choo YJ, Chung SJ, Ryu SH. Satisfaction of elementary students eating school lunch; association with level of involvement in school lunch service. Korean J Community Nutr. 2005; 10(5): 668-676.
REFERENCES
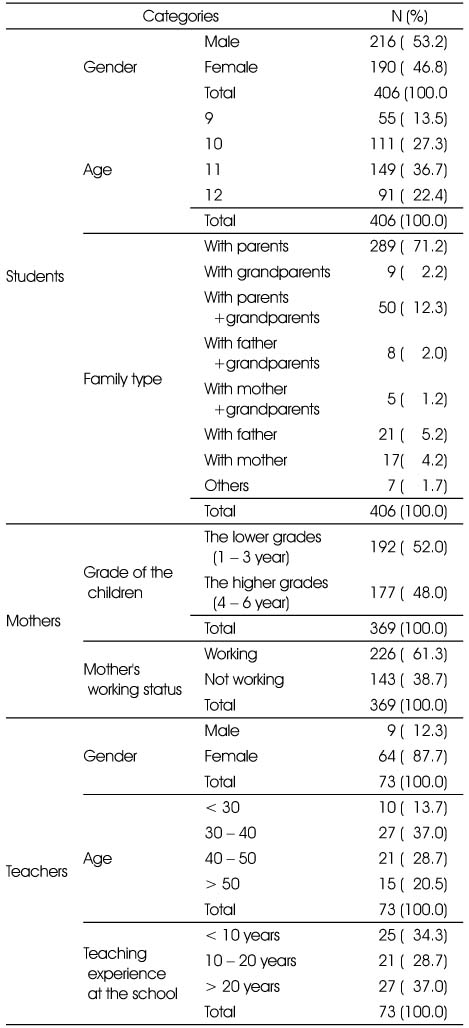

Table 3Nutrition knowledge, school life, and dietary behaviors related to MMS by frequency of breakfast (n = 396)1)
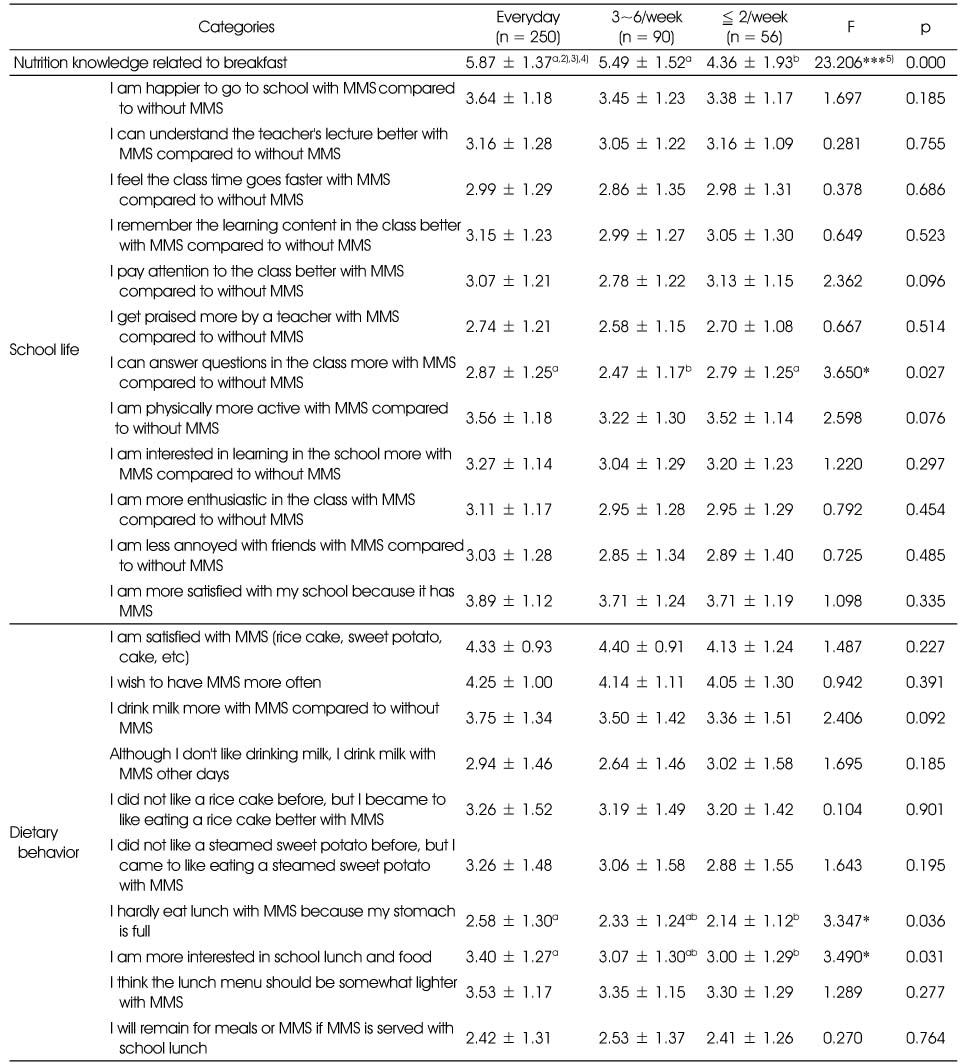
1) Total numbers of respondence among subjects
2) Mean ± SD
3) a,b For a given column, data not sharing a common superscript letter are statistically significantly different at P < 0.05
4) Scale of 1 = strongly disagree, 2 = disagree, 3 = neutral, 4 = agree, and 5 = strongly agree
5) *: p < 0.05, ***: p < 0.001


Figure & Data
REFERENCES
Citations
Citations to this article as recorded by 
 Cite
CiteEffects of Occasional Mid-Morning Snacks on Dietary Behaviors and School Life in Elementary School Students
Effects of Occasional Mid-Morning Snacks on Dietary Behaviors and School Life in Elementary School Students
General Characteristics of the subjects
Dietary behaviors of students
1) N (%), 2) *: p < 0.05, **: p < 0.001
Nutrition knowledge, school life, and dietary behaviors related to MMS by frequency of breakfast (n = 396)1)
1) Total numbers of respondence among subjects
2) Mean ± SD
3) a,b For a given column, data not sharing a common superscript letter are statistically significantly different at P < 0.05
4) Scale of 1 = strongly disagree, 2 = disagree, 3 = neutral, 4 = agree, and 5 = strongly agree
5) *: p < 0.05, ***: p < 0.001
Dietary behavior related to MMS by gender
1) Mean ± SD
2) Scale of 1 = strongly disagree, 2 = disagree, 3 = neutral, 4 = agree, and 5 = strongly agree
3) *: p < 0.05
MMS menu preferred by students
1) N (%)
Perception and satisfaction of mothers and teachers in relation to MMS
1) Mean ± SD
2) a,b For a given column, data not sharing a common superscript letter are statistically significantly different at p < 0.05
3) Scale of 1 = strongly disagree, 2 = disagree, 3 = neutral, 4 = agree, and 5 = strongly agree
4) *: p < 0.05, ***: p < 0.001
Mother's perception toward MMS in relation to children's school life and dietary behaviors by mother's working status
1) Mean ± SD
2) Scale of 1 = strongly disagree, 2 = disagree, 3 = neutral, 4 = agree, and 5 = strongly agree
3) *: p < 0.05, ***: p < 0.001
Comparison of opinion on light lunch menu with MMS between mothers and teachers
1) N (%)
2) ***: p < 0.001
Table 1
General Characteristics of the subjects
Table 2
Dietary behaviors of students
1) N (%), 2) *: p < 0.05, **: p < 0.001
Table 3
Nutrition knowledge, school life, and dietary behaviors related to MMS by frequency of breakfast (n = 396)1)
1) Total numbers of respondence among subjects 2) Mean ± SD 3) a,b For a given column, data not sharing a common superscript letter are statistically significantly different at 4) Scale of 1 = strongly disagree, 2 = disagree, 3 = neutral, 4 = agree, and 5 = strongly agree 5) *: p < 0.05, ***: p < 0.001
Table 4
Dietary behavior related to MMS by gender
1) Mean ± SD 2) Scale of 1 = strongly disagree, 2 = disagree, 3 = neutral, 4 = agree, and 5 = strongly agree 3) *: p < 0.05
Table 5
MMS menu preferred by students
1) N (%)
Table 6
Perception and satisfaction of mothers and teachers in relation to MMS
1) Mean ± SD 2) a,b For a given column, data not sharing a common superscript letter are statistically significantly different at 3) Scale of 1 = strongly disagree, 2 = disagree, 3 = neutral, 4 = agree, and 5 = strongly agree 4) *: p < 0.05, ***: p < 0.001
Table 7
Mother's perception toward MMS in relation to children's school life and dietary behaviors by mother's working status
1) Mean ± SD 2) Scale of 1 = strongly disagree, 2 = disagree, 3 = neutral, 4 = agree, and 5 = strongly agree 3) *: p < 0.05, ***: p < 0.001
Table 8
Comparison of opinion on light lunch menu with MMS between mothers and teachers
1) N (%) 2) ***: p < 0.001


