
Articles
- Page Path
- HOME > Korean J Community Nutr > Volume 31(2); 2026 > Article
-
Research Article
서울∙경기 지역 장애인복지관의 발달장애인 대상 급식관리 및 영양교육 현황과 요구도 분석 -
이미라1)
 , 이영미2),†, 장윤희2), 이유진2)
 - Foodservice management and nutrition education status and needs for individuals with developmental disabilities in welfare facilities in Seoul and Gyeonggi, Korea: a cross-sectional study
-
Mi-ra Lee1), Youngmi Lee2),†, Yun Hee Chang2), Yujin Lee2)
-
Korean Journal of Community Nutrition 2026;31(2):192-204.
DOI: https://doi.org/10.5720/kjcn.2026.00087
Published online: April 30, 2026
1)명지대학교 식품영양학전공 석사과정
2)명지대학교 식품영양학전공 교수
1)Master’s Student, Major of Food and Nutrition, Myongji University, Seoul, Korea
2)Professor, Major of Food and Nutrition, Myongji University, Seoul, Korea
- †Corresponding author: Youngmi Lee Major of Food and Nutrition, Myongji University, 34 Geobukgol-ro, Seodaemun-gu, Seoul 03674, Korea Tel: +82-31-330-6206 Fax: +82-31-330-6980 Email: zeromi@mju.ac.kr
• Received: March 5, 2026 • Revised: March 22, 2026 • Accepted: March 31, 2026
© 2026 The Korean Society of Community Nutrition
This is an Open-Access article distributed under the terms of the Creative Commons Attribution Non-Commercial License (https://creativecommons.org/licenses/by-nc/4.0) which permits unrestricted non-commercial use, distribution, and reproduction in any medium, provided the original work is properly cited.
- 288 Views
- 14 Download
Abstract
-
Objectives
- This study aimed to examine the current status of foodservice management and nutrition education practices, and the needs for individuals with developmental disabilities in welfare centers in Seoul and Gyeonggi, South Korea, and to compare the differences according to dietitians’ level of understanding of developmental disabilities.
-
Methods
- A cross-sectional survey was conducted among dietitians working at 65 welfare centers, and data from 45 centers were analyzed. The questionnaire assessed general characteristics, foodservice operations, nutrition education practices, perceived needs, and the understanding of developmental disabilities. Participants were classified into high- (n = 17) and low-understanding (n = 28) groups based on their self-rated understanding of developmental disabilities. Data were analyzed using IBM SPSS Statistics 29.0 (IBM Corp.).
-
Results
- All centers provided one daily meal (lunch), with one cook serving an average of 116 individuals. Only 11.1% of centers implemented nutrition education, primarily limited due to insufficient time and low expectations regarding the effectiveness of nutrition education. Overall, no significant differences were observed between the two groups in most aspects of foodservice management and nutrition education practices, although some specific items showed significant differences. The high-understanding group reported a significantly greater perceived need for nutrition education and placed higher importance on rapport-building and situational response skills. These findings suggest that structural constraints, including staffing, budget, and limited resources, may play a greater role than individual-level understanding in shaping foodservice and nutrition education practices.
-
Conclusion
- Welfare centers showed limited capacity to provide tailored foodservice and systematic nutrition education for adults with developmental disabilities. Strengthening staffing standards, improving foodservice environments, and developing standardized educational materials that consider communication levels are necessary. Moreover, expanding professional training opportunities for dietitians and establishing institutional support systems are essential to enhance sustainable nutrition education practices.
INTRODUCTION
METHODS
1) 설문지 구성
2) 분석 방법
RESULTS
1) 시설 이용 장애인 유형
2) 급식 운영 현황
1) 영양교육 실시 현황
2) 영양교육 미실시 이유 및 요구도
3) 영양교육 필요성 및 직무역량 인식
DISCUSSION
-
CONFLICT OF INTEREST
There are no financial or other issues that might lead to conflict of interest.
-
FUNDING
This work was supported by 2024 Research Fund of Myongji University.
-
DATA AVAILABILITY
Data are available upon request to the corresponding author.
NOTES
Fig. 1.Proportion of facilities equipped with foodservice-related environmental supports for individuals with developmental disabilities (n = 45; unit: %).
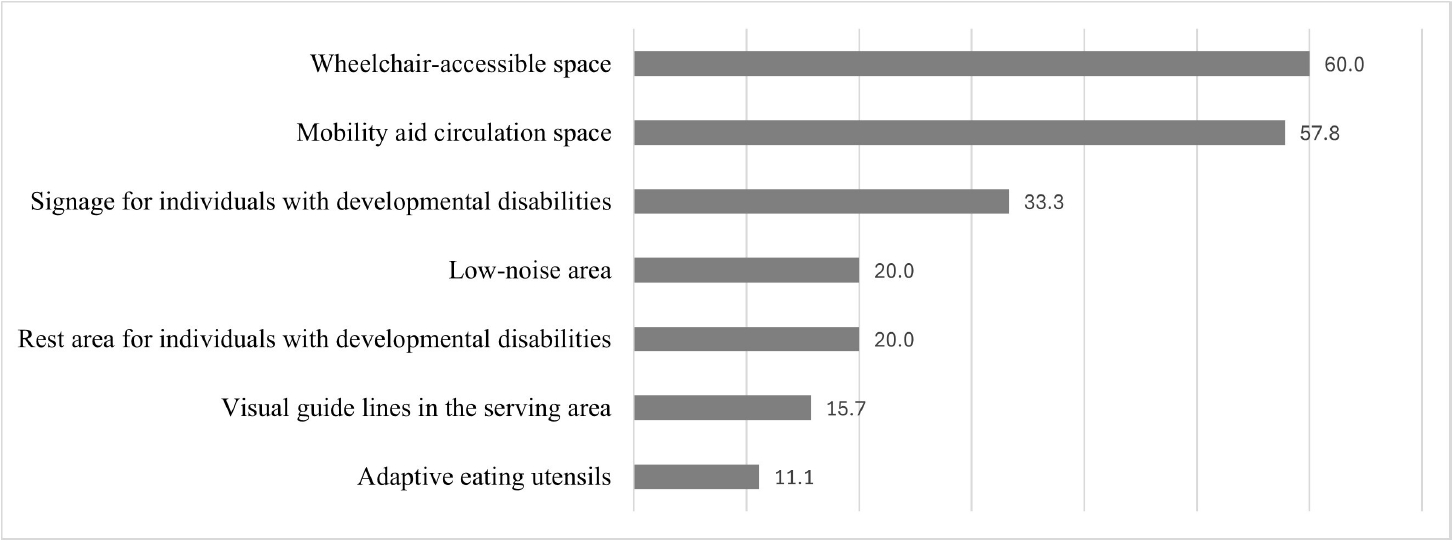
Table 1.General characteristics of participants
| Variables | Low-understanding (n = 28) | High-understanding (n = 17) | Total (n = 45) | P-value |
|---|---|---|---|---|
| Age (year) | ||||
| 20–39 | 9 (32.1) | 3 (17.6) | 12 (26.7) | 0.4841) |
| 40–49 | 12 (42.9) | 10 (58.8) | 22 (48.9) | |
| ≥ 50 | 7 (25.0) | 4 (23.6) | 11 (24.4) | |
| Mean | 41.50 ± 8.46 | 45.00 ± 5.99 | 42.82 ± 7.74 | 0.1432) |
| Workplace location | ||||
| Seoul | 11 (39.3) | 9 (52.9) | 20 (44.4) | 0.537 |
| Gyeonggi | 17 (60.7) | 8 (47.1) | 25 (55.6) | |
| Total work experience in welfare facilities (year) | ||||
| < 1 | 4 (14.3) | 0 (0.0) | 4 (8.9) | 0.369 |
| 1–4 | 9 (32.1) | 7 (41.2) | 16 (35.6) | |
| 5–9 | 9 (32.1) | 4 (23.5) | 13 (28.9) | |
| ≥ 10 | 6 (21.5) | 6 (35.3) | 12 (26.6) | |
| Mean | 5.81 ± 3.87 | 7.86 ± 5.24 | 6.58 ± 4.49 | 0.141 |
| Current job tenure (year) | ||||
| < 1 | 7 (25.0) | 1 (5.9) | 8 (17.8) | 0.303 |
| 1–4 | 8 (28.6) | 8 (47.1) | 16 (35.6) | |
| 5–9 | 10 (35.7) | 5 (29.4) | 15 (33.3) | |
| ≥ 10 | 3 (10.7) | 3 (17.6) | 6 (13.3) | |
| Mean | 5.03 ± 3.86 | 6.24 ± 4.98 | 5.49 ± 4.30 | 0.368 |
| Employment status | ||||
| Permanent | 18 (64.3) | 13 (76.5) | 31 (68.9) | 0.513 |
| Temporary | 10 (35.7) | 4 (23.5) | 14 (31.1) | |
| Working hours per day (hr) | ||||
| < 8 | 4 (14.3) | 4 (23.5) | 8 (17.8) | 0.452 |
| ≥ 8 | 24 (85.7) | 13 (76.5) | 37 (82.2) | |
| Mean | 7.71 ± 1.10 | 7.26 ± 1.43 | 7.54 ± 1.24 | 0.234 |
Table 2.Participants’ understanding of developmental disability characteristics
| Variables1) | Low-understanding (n = 28) | High-understanding (n = 17) | Total (n = 45) | P-value2) |
|---|---|---|---|---|
| Definition of intellectual disability | 2.46 ± 0.74 | 4.00 ± 0.36 | 3.04 ± 0.97 | < 0.001 |
| General characteristics of intellectual disability | 2.46 ± 0.69 | 3.59 ± 0.50 | 2.89 ± 0.83 | < 0.001 |
| Eating behavior characteristics of intellectual disability | 2.43 ± 0.69 | 3.29 ± 0.47 | 2.76 ± 0.74 | < 0.001 |
| Definition of autism spectrum disorder | 2.39 ± 0.73 | 3.65 ± 0.49 | 2.87 ± 0.89 | < 0.001 |
| General characteristics of autism spectrum disorder | 2.39 ± 0.73 | 3.47 ± 0.51 | 2.80 ± 0.84 | < 0.001 |
| Eating behavior characteristics of autism spectrum disorder | 2.36 ± 0.67 | 3.29 ± 0.58 | 2.71 ± 0.78 | < 0.001 |
| Mean | 2.41 ± 0.64 | 3.54 ± 0.32 | 2.84 ± 0.77 | < 0.001 |
Mean ± SD.
Low- and high-understanding groups were classified based on the median score of the developmental disability understanding scale (mean score of 6 items; median = 3.0).
1)Measured using a 5-point Likert scale based on self-reported ability to explain each item (1 = strongly disagree, 5 = strongly agree).
2)P-values by Mann–Whitney U test.
Table 3.Characteristics of service users in the surveyed facilities
| Variables | Low-understanding (n = 28) | High-understanding (n = 17) | Total (n = 45) | P-value1) |
|---|---|---|---|---|
| Types of disabilities among service users2) | ||||
| Intellectual disability | 28 (100.0) | 17 (100.0) | 45 (100.0) | - |
| Autism spectrum disorder | 25 (89.3) | 15 (88.2) | 40 (88.9) | > 0.999 |
| Physical disability | 26 (92.9) | 13 (76.5) | 39 (86.7) | 0.179 |
| Neurological disability | 22 (78.6) | 12 (70.6) | 34 (75.6) | 0.722 |
| Mental disorder | 22 (78.6) | 11 (64.7) | 33 (73.3) | 0.325 |
| Language disorder | 18 (64.3) | 12 (70.6) | 30 (66.7) | 0.752 |
| Hearing impairment | 19 (67.9) | 10 (58.8) | 29 (64.4) | 0.539 |
| Primary disability type3) | ||||
| Developmental disability4) | 15 (53.6) | 13 (76.5) | 28 (62.2) | 0.215 |
| Others | 13 (46.4) | 4 (23.5) | 17 (37.8) | |
| Primary age group of service users (year) | ||||
| 6–18 | 2 (7.1) | 0 (0.0) | 2 (4.4) | 0.740 |
| 19–39 | 18 (64.3) | 10 (58.8) | 28 (62.2) | |
| 40–64 | 7 (25.0) | 6 (35.3) | 13 (28.9) | |
| ≥ 65 | 1 (3.6) | 1 (5.9) | 2 (4.4) | |
| Communication ability level in developmental disabilities (%) | ||||
| 10–39 | 5 (17.9) | 1 (5.9) | 6 (13.3) | 0.665 |
| 40–59 | 7 (25.0) | 6 (35.3) | 13 (28.9) | |
| 60–79 | 15 (53.6) | 9 (52.9) | 24 (53.3) | |
| 80–100 | 1 (3.6) | 1 (5.9) | 2 (4.4) |
n (%).
Low- and high-understanding groups were classified based on the median score of the developmental disability understanding scale (mean score of 6 items; median = 3.0).
1)P-values by chi-square test or Fisher’s exact test.
2)Multiple responses allowed; categories indicate facilities with at least one service user with the respective disability.
3)Respondents were asked to select one primary disability type representing the largest proportion of service users.
4)Includes intellectual disability and autism spectrum disorder.
Table 4.Food service operational characteristics of the surveyed facilities
| Variables | Low-understanding (n = 28) | High-understanding (n = 17) | Total (n = 45) | P-value |
|---|---|---|---|---|
| Daily number of meals served1) | 162.61 ± 84.46 | 195.29 ± 72.10 | 174.96 ± 80.77 | 0.1015) |
| Daily number of meals served to service users2) | ||||
| < 100 | 19 (67.9) | 6 (35.3) | 25 (55.6) | 0.0626) |
| ≥ 100 | 9 (32.1) | 11 (64.7) | 20 (44.4) | |
| Mean | 95.61 ± 76.76 | 124.71 ± 54.55 | 106.60 ± 70.01 | 0.049 |
| Type of meals served3) | ||||
| Lunch | 28 (100.0) | 17 (100.0) | 45 (100.0) | - |
| Dinner | 1 (3.6) | 0 (0.0) | 1 (2.2) | > 0.999 |
| Food cost per meal (KRW) | ||||
| < 3,000 | 6 (21.4) | 4 (23.5) | 10 (22.2) | > 0.999 |
| ≥ 3,000 | 22 (78.6) | 13 (76.5) | 35 (77.8) | |
| Mean | 3,517 ± 665.72 | 3,211 ± 1027.06 | 3,402 ± 823.44 | 0.231 |
| Number of cooks | ||||
| 1 | 16 (57.1) | 8 (47.1) | 24 (53.3) | 0.590 |
| 2 | 8 (28.6) | 8 (47.1) | 16 (35.6) | |
| 3 | 2 (7.1) | 1 (5.9) | 3 (6.7) | |
| ≥ 4 | 2 (7.1) | 0 (0.0) | 2 (4.4) | |
| Mean | 1.68 ± 1.02 | 1.59 ± 0.61 | 1.64 ± 0.80 | 0.774 |
| Meals served per cook4) | 104.51 ± 35.52 | 135.05 ± 68.45 | 116.04 ± 52.02 | 0.055 |
| Number of food service support staff (excluding cooks) | ||||
| 1–2 | 7 (25.0) | 1 (5.9) | 8 (17.8) | 0.083 |
| 3–4 | 9 (32.1) | 3 (17.6) | 12 (26.7) | |
| ≥ 5 | 12 (42.9) | 13 (76.5) | 25 (55.6) | |
| Mean | 4.86 ± 3.56 | 6.53 ± 2.52 | 5.49 ± 3.29 | 0.020 |
n (%) or Mean ± SD.
Low- and high-understanding groups were classified based on the median score of the developmental disability understanding scale (mean score of 6 items; median = 3.0).
1)Daily number of meals served includes all meal recipients (e.g., service users, staff, and others).
2)Daily number of meals served to service users refers to meals provided to individuals with disabilities only.
3)Multiple responses allowed.
4)Calculated as the total number of meals served divided by the number of cooks.
5)P-values by independent t-test or Mann–Whitney U test.
6)P-values by chi-square test or Fisher’s exact test.
Table 5.Primary considerations in menu planning and perceived importance of menu-planning factors for individuals with developmental disabilities
| Variables | Low-understanding (n = 28) | High-understanding (n = 17) | Total (n = 45) | P-value1) |
|---|---|---|---|---|
| Primary consideration in menu planning2) | ||||
| User preferences | 12 (42.9) | 8 (47.1) | 20 (44.4) | 0.858 |
| Budget | 10 (35.7) | 4 (23.5) | 14 (31.1) | |
| Nutritional requirements | 3 (10.7) | 2 (11.8) | 5 (11.1) | |
| Seasonal factors | 2 (7.1) | 1 (5.9) | 3 (6.7) | |
| Ease of food preparation | 1 (3.6) | 2 (11.8) | 3 (6.7) | |
| Importance in menu planning for developmental disabilities3) | ||||
| Food preferences and acceptability | 4.07 ± 0.76 | 4.53 ± 0.51 | 4.24 ± 0.71 | 0.048 |
| Appropriate food size | 3.75 ± 0.92 | 4.00 ± 0.79 | 3.84 ± 0.87 | 0.466 |
| Appropriate food temperature | 3.82 ± 0.77 | 4.00 ± 0.61 | 3.89 ± 0.71 | 0.528 |
| Dietary restrictions | 3.29 ± 1.04 | 3.71 ± 0.92 | 3.44 ± 1.01 | 0.180 |
| Visual presentation of meals | 4.04 ± 0.79 | 4.29 ± 0.68 | 4.13 ± 0.75 | 0.296 |
n (%) or Mean ± SD.
Low- and high-understanding groups were classified based on the median score of the developmental disability understanding scale (mean score of 6 items; median = 3.0).
1)P-values by Fisher’s exact test or Mann–Whitney U test.
2)Participants were asked to select the single most important consideration in menu planning.
3)Importance of each factor in menu planning for individuals with developmental disabilities was assessed using a 5-point Likert scale (1 = strongly disagree, 5 = strongly agree).
Table 6.Current status of nutrition education practices in facilities implementing nutrition education
| Variables | Low-understanding (n = 2) | High-understanding (n = 3) | Total (n = 5) | P-value1) |
|---|---|---|---|---|
| Frequency of nutrition education (per year) | ||||
| Once | 2 (100.0) | 2 (66.7) | 4 (80.0) | > 0.999 |
| 12 times | 0 (0.0) | 1 (33.3) | 1 (20.0) | |
| Duration of nutrition education (min) | ||||
| 10–29.9 | 1 (50.0) | 0 (0.0) | 1 (20.0) | > 0.999 |
| 30–59.9 | 1 (50.0) | 2 (66.7) | 3 (60.0) | |
| ≥ 60 | 0 (0.0) | 1 (33.3) | 1 (20.0) | |
| Type of nutrition education2) | ||||
| Lecture-based education | 2 (100.0) | 3 (100.0) | 5 (100.0) | - |
| Experiential education | 0 (0.0) | 3 (100.0) | 3 (60.0) | 0.100 |
| Video-based education | 0 (0.0) | 2 (66.7) | 2 (40.0) | 0.400 |
| Education using visual materials | 1 (50.0) | 1 (33.3) | 2 (40.0) | > 0.999 |
| Regular provision of nutrition information | 1 (50.0) | 0 (0.0) | 1 (20.0) | 0.400 |
| Others | 1 (50.0) | 0 (0.0) | 1 (20.0) | > 0.999 |
| Topics of nutrition education2) | ||||
| Diet-related diseases and obesity | 0 (0.0) | 2 (66.7) | 2 (40.0) | 0.400 |
| Food refusal and nutritional deficiencies | 0 (0.0) | 1 (33.3) | 1 (20.0) | > 0.999 |
| Picky eating | 0 (0.0) | 3 (100.0) | 3 (60.0) | 0.100 |
| Others | 2 (100.0) | 0 (0.0) | 2 (40.0) | > 0.999 |
| Difficulties in providing nutrition education3) | ||||
| Lack of appropriate teaching methods | 0 (0.0) | 1 (33.3) | 1 (20.0) | > 0.999 |
| Communication difficulties | 1 (50.0) | 0 (0.0) | 1 (20.0) | |
| Challenging behaviors | 0 (0.0) | 1 (33.3) | 1 (20.0) | |
| Lack of education materials | 1 (50.0) | 1 (33.3) | 2 (40.0) |
n (%) or Mean ± SD.
Low- and high-understanding groups were classified based on the median score of the developmental disability understanding scale (mean score of 6 items; median = 3.0).
1)P-values by Fisher’s exact test.
2)Multiple responses allowed.
3)Participants were asked to select the single largest difficulty.
Table 7.Reasons for not implementing nutrition education and related educational needs for individuals with developmental disabilities
| Variables1) | Low-understanding (n = 26) | High-understanding (n = 14) | Total (n = 40) | P-value2) |
|---|---|---|---|---|
| Reasons for not implementing nutrition education1) | ||||
| Lack of knowledge about developmental disabilities | 6 (23.1) | 2 (14.3) | 8 (20.0) | 0.852 |
| Lack of educational materials | 3 (11.5) | 1 (7.1) | 4 (10.0) | |
| Insufficient time | 8 (30.8) | 5 (35.7) | 13 (32.5) | |
| Low awareness of the importance of nutrition education | 1 (3.8) | 2 (14.3) | 3 (7.5) | |
| Perceived low effectiveness of nutrition education | 6 (23.1) | 3 (21.4) | 9 (22.5) | |
| Others | 2 (7.7) | 1 (7.2) | 3 (7.5) | |
| Educational topic needs | ||||
| Food preoccupation and obesity | 7 (26.9) | 8 (57.1) | 15 (37.5) | 0.333 |
| Food refusal and nutritional imbalance | 4 (15.4) | 1 (7.1) | 5 (12.5) | |
| Picky eating | 14 (53.8) | 5 (35.8) | 19 (47.5) | |
| Others | 1 (3.9) | 0 (0.0) | 1 (2.5) | |
| Support needs for nutrition education implementation | ||||
| Provision of educational materials | 17 (65.4) | 8 (57.1) | 25 (62.5) | 0.581 |
| Training programs for nutrition education | 5 (19.2) | 3 (21.4) | 8 (20.0) | |
| Development of educational guidelines | 4 (15.4) | 2 (14.3) | 6 (15.0) | |
| Improving awareness among facility managers | 0 (0.0) | 1 (7.2) | 1 (2.5) |
n (%).
Low- and high-understanding groups were classified based on the median score of the developmental disability understanding scale (mean score of 6 items; median = 3.0).
1)For each domain, participants were asked to select the single most important item.
2)P-values by Fisher’s exact test or Mann–Whitney U test.
Table 8.Perceptions of the need for nutrition education and importance of job competencies for individuals with developmental disabilities
| Variables1) | Low-understanding (n = 28) | High-understanding (n = 17) | Total (n = 45) | P-value2) |
|---|---|---|---|---|
| Perceived need for nutrition education | ||||
| Need for nutritional improvement | 3.82 ± 0.72 | 4.12 ± 0.69 | 3.93 ± 0.72 | 0.198 |
| Need for nutrition education | 3.50 ± 0.63 | 4.00 ± 0.70 | 3.69 ± 0.70 | 0.032 |
| Effectiveness of nutrition education | 3.11 ± 0.78 | 3.35 ± 0.93 | 3.20 ± 0.84 | 0.387 |
| Perceived importance of job competencies | ||||
| Nutrition counseling skills | 3.82 ± 0.81 | 4.12 ± 0.60 | 3.93 ± 0.75 | 0.242 |
| Understanding of characteristics of developmental disabilities | 4.25 ± 0.79 | 4.24 ± 0.56 | 4.24 ± 0.71 | 0.687 |
| Communication skills | 4.07 ± 0.76 | 4.24 ± 0.66 | 4.13 ± 0.72 | 0.526 |
| Rapport-building skills | 3.96 ± 0.74 | 4.41 ± 0.61 | 4.13 ± 0.72 | 0.039 |
| Situational response skills | 3.89 ± 0.62 | 4.35 ± 0.60 | 4.07 ± 0.65 | 0.018 |
| Ability to develop nutrition education materials | 3.93 ± 0.66 | 4.12 ± 0.60 | 4.00 ± 0.64 | 0.377 |
| Mean | 3.98 ± 0.63 | 4.24 ± 0.50 | 4.08 ± 0.59 | 0.164 |
- 1. Korean Law Information Center. Act on the guarantee of rights and support for persons with developmental disabilities [Internet]. Ministry of Health and Welfare; 2025 [cited 2025 Nov 25]. Available from: https://www.law.go.kr/%EB%B2%95%EB%A0%B9/%EB%B0%9C%EB%8B%AC%EC%9E%A5%EC%95%A0%EC%9D%B8%EA%B6%8C%EB%A6%AC%EB%B3%B4%EC%9E%A5%EB%B0%8F%EC%A7%80%EC%9B%90%EC%97%90%EA%B4%80%ED%95%9C%EB%B2%95%EB%A5%A0
- 2. Korean Statistical Information Service. Number of registered persons with disabilities by type nationwide [Internet]. Ministry of Data and Statistics; 2024 [cited 2025 Nov 25]. Available from: https://kosis.kr/statHtml/statHtml.do?sso=ok&returnurl=https%3A%2F%2Fkosis.kr%3A443%2FstatHtml%2FstatHtml.do%3Fconn_path%3DMT_ZTITLE%26list_id%3D211_01_002_009_002%26obj_var_id%3D%26seqNo%3D%26tblId%3DDT_211011_2023_B003%26vw_cd%3DMT_ZTITLE%26itm_id%3D%26language%3Dkor%26lang_mode%3Dko%26orgId%3D211%26
- 3. Lee EY, Kang WJ. Current status of persons with developmental disabilities in Korea and the role of private insurance. Korea Insurance Research Institute; 2024 Dec. Report No. 2024-12.
- 4. Ministry of Food and Drug Safety (MFDS). Foodservice management guidelines for social welfare facilities for persons with disabilities I. MFDS; 2024.
- 5. American Psychiatric Association (APA). Diagnostic and statistical manual of mental disorders: DSM-IV. 4th ed. APA; 1994.
- 6. Sharp WG, Berry RC, McCracken C, Nuhu NN, Marvel E, Saulnier CA, et al. Feeding problems and nutrient intake in children with autism spectrum disorders: a meta-analysis and comprehensive review of the literature. J Autism Dev Disord 2013; 43(9): 2159-2173. ArticlePubMedPDF
- 7. Cermak SA, Curtin C, Bandini LG. Food selectivity and sensory sensitivity in children with autism spectrum disorders. J Am Diet Assoc 2010; 110(2): 238-246. ArticlePubMedPMC
- 8. Rogers SJ, Hepburn S, Wehner E. Parent reports of sensory symptoms in toddlers with autism and those with other developmental disorders. J Autism Dev Disord 2003; 33(6): 631-642. ArticlePubMedPDF
- 9. Castro K, Faccioli LS, Baronio D, Gottfried C, Perry IS, Riesgo R. Feeding behavior and dietary intake of male children and adolescents with autism spectrum disorder: a case-control study. Int J Dev Neurosci 2016; 53: 68-74. ArticlePubMedLink
- 10. Li YJ, Xie XN, Lei X, Li YM, Lei X. Global prevalence of obesity, overweight and underweight in children, adolescents and adults with autism spectrum disorder, attention-deficit hyperactivity disorder: a systematic review and meta-analysis. Obes Rev 2020; 21(12): e13123.ArticlePubMedLink
- 11. Weil E, Wachterman M, McCarthy EP, Davis RB, O’Day B, Iezzoni LI, et al. Obesity among adults with disabling conditions. JAMA 2002; 288(10): 1265-1268. ArticlePubMed
- 12. Park SH, Hwang SY, Jang WY. The effect of home-linked positive behavior support program on change of table manners of students with developmental disabilities. Korean J Phys Mult Health Disabil 2012; 55(4): 179-198. Article
- 13. Choi A, Lee S. The effect of health care program on health knowledge and health promoting behaviors of young adults with developmental disabilities. Spec Educ Res 2020; 19(2): 101-131. Article
- 14. Sharp WG, Burrell TL, Berry RC, Stubbs KH, McCracken CE, Gillespie SE, et al. The autism managing eating aversions and limited variety plan vs parent education: a randomized clinical trial. J Pediatr 2019; 211: 185-192.e1. ArticlePubMedPMC
- 15. Buro AW, Gray HL, Kirby RS, Marshall J, Strange M, Pang T, et al. Feasibility of a virtual nutrition intervention for adolescents with autism spectrum disorder. Autism 2022; 26(6): 1436-1450. ArticlePubMedLink
- 16. Kim J, Jeon MS. Qualitative research to build a nutrition education program operation model at social welfare facilities for people with disabilities: one-on-one in-depth interview. J Korean Diet Assoc 2024; 30(2): 83-94. Article
- 17. Park HJ, Choi SJ, Kim Y, Park J, Kim YR, Lee SH, et al. Dietary behavior and food preferences according to age and the parents’ nutrition education needs of children with autism spectrum disorder. J Korean Soc Food Cult 2020; 35(3): 241-255. Article
- 18. Lee MK, Kim SH, Oh WC, Oh MA, Kim JH, Hwang JH, et al. 2023 national survey on persons with disabilities. Ministry of Health and Welfare, Korea Institute for Health and Social Affairs; 2023 Nov. Report No. 2023-132.
- 19. Ministry of Health and Welfare (MOHW). 2025 yearbook of welfare facilities for persons with disabilities [Internet]. MOHW; 2025 [cited 2025 Nov 25]. Available from: https://www.mohw.go.kr/board.es?mid=a10413000000&bid=0021&act=view&list_no=1485440&tag=&nPage=1
- 20. Choi MJ. A survey on nutrition education needs for children with disabilities and development of training program for nutrition teachers. [master’s thesis]. Chung-Ang University; 2019.
- 21. Park SH, Jung HA. Investigation of the management of foodservice facilities in community child centers in Daegu and Gyeongbuk area. J East Asian Soc Diet Life 2017; 27(4): 459-472. Article
- 22. Oh D, Na W, Hwang S, Lee JJ, Yang YJ, Lee H, et al. Survey of foodservice management status according to welfare facility type for disabled persons. J Korean Diet Assoc 2023; 29(3): 173-189. Article
- 23. Ko MH. Analysis of the food service management status and job satisfaction of nutritionists in disability care facilities in Jeju. [master’s thesis]. Jeju National University; 2024.
- 24. Park YB, Jeon MS. A study on the demand for development of nutrition education program for elderly welfare facilities : focusing on in-depth interviews. Korean J Hum Ecol 2024; 33(4): 533-544. Article
- 25. Lee HR. A study on the conditions of the nutrition educations and the perceptions of the nutrition teachers and dietitians in the primary and secondary schools in Gyeongnam area. [master’s thesis]. Kyungnam University; 2013.
- 26. Zeng M, Zhu Y, Cai Z, Xian J, Li S, Wang T, et al. Nutrition literacy of middle school students and its influencing factors: a cross-sectional study in Chongqing, China. Front Public Health 2022; 10: 807526.ArticlePubMedPMC
- 27. Hoge A, Labeye M, Donneau AF, Nekoee HZ, Husson E, Guillaume M. Health literacy and its associations with understanding and perception of front-of-package nutrition labels among higher education students. Int J Environ Res Public Health 2022; 19(14): 8751.ArticlePubMedPMC
- 28. Lee HS. Foodservice management and food sanitation management in the welfare institutions for the disabled in Korea. Korean J Community Nutr 2008; 13(4): 520-530.
- 29. Korean Law Information Center. Enforcement rule of the welfare of persons with disabilities act [Internet]. Ministry of Health and Welfare; 2025 [cited 2025 Nov 25]. Available from: https://www.law.go.kr/%EB%B2%95%EB%A0%B9/%EC%9E%A5%EC%95%A0%EC%9D%B8%EB%B3%B5%EC%A7%80%EB%B2%95%EC%8B%9C%ED%96%89%EA%B7%9C%EC%B9%99
- 30. Gyeonggi Office of Education. - Gyeonggi-do kindergarten, elementary, middle, high, special, and other schools - 2025 School meal expense support plan [Internet]. Gyeonggi Office of Education; 2025 [cited 2026 Mar 26]. Available from: https://www.goe.go.kr/resource/old/BBSMSTR_000000030174/BBS_202504170957455430.pdf
- 31. Ahn MY, Moon HW, Chung HY, Park YK. Nutrient and carotenoid intakes and dietary habits in mentally disabled adults. Korean J Community Nutr 2015; 20(3): 208-219. Article
- 32. Gast DAA, de Wit GLC, van Hoof A, de Vries JHM, van Hemert B, Didden R, et al. Diet quality among people with intellectual disabilities and borderline intellectual functioning. J Appl Res Intellect Disabil 2022; 35(2): 488-494. ArticlePubMedPMCLink
- 33. Adolfsson P, Sydner YM, Fjellström C, Lewin B, Andersson A. Observed dietary intake in adults with intellectual disability living in the community. Food Nutr Res 2008; 52. https://doi.org/10.3402/fnr.v52i0.1857. Article
- 34. Nimbley E, Golds L, Sharpe H, Gillespie-Smith K, Duffy F. Sensory processing and eating behaviours in autism: a systematic review. Eur Eat Disord Rev 2022; 30(5): 538-559. ArticlePubMedPMCLink
- 35. Nisticò V, Faggioli R, Tedesco R, Giordano B, Priori A, Gambini O, et al. Brief report: sensory sensitivity is associated with disturbed eating in adults with autism spectrum disorders without intellectual disabilities. J Autism Dev Disord 2023; 53(8): 3295-3300. ArticlePubMedPDF
- 36. Dean S, Marshall J, Whelan E, Watson J, Zorbas C, Cameron AJ. A systematic review of health promotion programs to improve nutrition for people with intellectual disability. Curr Nutr Rep 2021; 10(4): 255-266. ArticlePubMedPDF
- 37. Kim YS, Kim KN, Chang NS. Foodservice management in institutions for the disabled in Korea. J Korean Soc Food Cult 2001; 16(2): 187-193.
- 38. Johnson C, Hobson S, Garcia AC, Matthews J. Nutrition and food skills education for adults with developmental disabilities. Can J Diet Pract Res 2011; 72(1): 7-13. ArticlePubMed
- 39. Kolset SO. Intellectual disability and nutrition-related health. EMBO Mol Med 2020; 12(10): e12899.ArticlePubMedPMCLink
- 40. MacCallum RC, Zhang S, Preacher KJ, Rucker DD. On the practice of dichotomization of quantitative variables. Psychol Methods 2002; 7(1): 19-40. ArticlePubMedPMC
REFERENCES
Figure & Data
REFERENCES
Citations
Citations to this article as recorded by 
 Cite
Cite- Figure
-
- We recommend
- Related articles
-
- Research trends in dietary behaviors and nutrition education among individuals with developmental disabilities in Korea: a scoping review (2015–2025)
- Analysis of the relationship between foodservice staffing and foodservice quality in elderly care facilities in Korea: a cross-sectional study
- Development and applicability evaluation of a nutrition education program for residents and users of disability social welfare facilities in Korea: a mixed-methods study
- Nutrition education programs necessary for social welfare facilities for persons with disabilities: a cross-sectional study
Foodservice management and nutrition education status and needs for individuals with developmental disabilities in welfare facilities in Seoul and Gyeonggi, Korea: a cross-sectional study

Fig. 1. Proportion of facilities equipped with foodservice-related environmental supports for individuals with developmental disabilities (n = 45; unit: %).
Fig. 1.
Foodservice management and nutrition education status and needs for individuals with developmental disabilities in welfare facilities in Seoul and Gyeonggi, Korea: a cross-sectional study
| Variables | Low-understanding (n = 28) | High-understanding (n = 17) | Total (n = 45) | P-value |
|---|---|---|---|---|
| Age (year) | ||||
| 20–39 | 9 (32.1) | 3 (17.6) | 12 (26.7) | 0.484 |
| 40–49 | 12 (42.9) | 10 (58.8) | 22 (48.9) | |
| ≥ 50 | 7 (25.0) | 4 (23.6) | 11 (24.4) | |
| Mean | 41.50 ± 8.46 | 45.00 ± 5.99 | 42.82 ± 7.74 | 0.143 |
| Workplace location | ||||
| Seoul | 11 (39.3) | 9 (52.9) | 20 (44.4) | 0.537 |
| Gyeonggi | 17 (60.7) | 8 (47.1) | 25 (55.6) | |
| Total work experience in welfare facilities (year) | ||||
| < 1 | 4 (14.3) | 0 (0.0) | 4 (8.9) | 0.369 |
| 1–4 | 9 (32.1) | 7 (41.2) | 16 (35.6) | |
| 5–9 | 9 (32.1) | 4 (23.5) | 13 (28.9) | |
| ≥ 10 | 6 (21.5) | 6 (35.3) | 12 (26.6) | |
| Mean | 5.81 ± 3.87 | 7.86 ± 5.24 | 6.58 ± 4.49 | 0.141 |
| Current job tenure (year) | ||||
| < 1 | 7 (25.0) | 1 (5.9) | 8 (17.8) | 0.303 |
| 1–4 | 8 (28.6) | 8 (47.1) | 16 (35.6) | |
| 5–9 | 10 (35.7) | 5 (29.4) | 15 (33.3) | |
| ≥ 10 | 3 (10.7) | 3 (17.6) | 6 (13.3) | |
| Mean | 5.03 ± 3.86 | 6.24 ± 4.98 | 5.49 ± 4.30 | 0.368 |
| Employment status | ||||
| Permanent | 18 (64.3) | 13 (76.5) | 31 (68.9) | 0.513 |
| Temporary | 10 (35.7) | 4 (23.5) | 14 (31.1) | |
| Working hours per day (hr) | ||||
| < 8 | 4 (14.3) | 4 (23.5) | 8 (17.8) | 0.452 |
| ≥ 8 | 24 (85.7) | 13 (76.5) | 37 (82.2) | |
| Mean | 7.71 ± 1.10 | 7.26 ± 1.43 | 7.54 ± 1.24 | 0.234 |
| Variables |
Low-understanding (n = 28) | High-understanding (n = 17) | Total (n = 45) | P-value |
|---|---|---|---|---|
| Definition of intellectual disability | 2.46 ± 0.74 | 4.00 ± 0.36 | 3.04 ± 0.97 | < 0.001 |
| General characteristics of intellectual disability | 2.46 ± 0.69 | 3.59 ± 0.50 | 2.89 ± 0.83 | < 0.001 |
| Eating behavior characteristics of intellectual disability | 2.43 ± 0.69 | 3.29 ± 0.47 | 2.76 ± 0.74 | < 0.001 |
| Definition of autism spectrum disorder | 2.39 ± 0.73 | 3.65 ± 0.49 | 2.87 ± 0.89 | < 0.001 |
| General characteristics of autism spectrum disorder | 2.39 ± 0.73 | 3.47 ± 0.51 | 2.80 ± 0.84 | < 0.001 |
| Eating behavior characteristics of autism spectrum disorder | 2.36 ± 0.67 | 3.29 ± 0.58 | 2.71 ± 0.78 | < 0.001 |
| Mean | 2.41 ± 0.64 | 3.54 ± 0.32 | 2.84 ± 0.77 | < 0.001 |
| Variables | Low-understanding (n = 28) | High-understanding (n = 17) | Total (n = 45) | P-value |
|---|---|---|---|---|
| Types of disabilities among service users |
||||
| Intellectual disability | 28 (100.0) | 17 (100.0) | 45 (100.0) | - |
| Autism spectrum disorder | 25 (89.3) | 15 (88.2) | 40 (88.9) | > 0.999 |
| Physical disability | 26 (92.9) | 13 (76.5) | 39 (86.7) | 0.179 |
| Neurological disability | 22 (78.6) | 12 (70.6) | 34 (75.6) | 0.722 |
| Mental disorder | 22 (78.6) | 11 (64.7) | 33 (73.3) | 0.325 |
| Language disorder | 18 (64.3) | 12 (70.6) | 30 (66.7) | 0.752 |
| Hearing impairment | 19 (67.9) | 10 (58.8) | 29 (64.4) | 0.539 |
| Primary disability type |
||||
| Developmental disability |
15 (53.6) | 13 (76.5) | 28 (62.2) | 0.215 |
| Others | 13 (46.4) | 4 (23.5) | 17 (37.8) | |
| Primary age group of service users (year) | ||||
| 6–18 | 2 (7.1) | 0 (0.0) | 2 (4.4) | 0.740 |
| 19–39 | 18 (64.3) | 10 (58.8) | 28 (62.2) | |
| 40–64 | 7 (25.0) | 6 (35.3) | 13 (28.9) | |
| ≥ 65 | 1 (3.6) | 1 (5.9) | 2 (4.4) | |
| Communication ability level in developmental disabilities (%) | ||||
| 10–39 | 5 (17.9) | 1 (5.9) | 6 (13.3) | 0.665 |
| 40–59 | 7 (25.0) | 6 (35.3) | 13 (28.9) | |
| 60–79 | 15 (53.6) | 9 (52.9) | 24 (53.3) | |
| 80–100 | 1 (3.6) | 1 (5.9) | 2 (4.4) |
| Variables | Low-understanding (n = 28) | High-understanding (n = 17) | Total (n = 45) | P-value |
|---|---|---|---|---|
| Daily number of meals served |
162.61 ± 84.46 | 195.29 ± 72.10 | 174.96 ± 80.77 | 0.101 |
| Daily number of meals served to service users |
||||
| < 100 | 19 (67.9) | 6 (35.3) | 25 (55.6) | 0.062 |
| ≥ 100 | 9 (32.1) | 11 (64.7) | 20 (44.4) | |
| Mean | 95.61 ± 76.76 | 124.71 ± 54.55 | 106.60 ± 70.01 | 0.049 |
| Type of meals served |
||||
| Lunch | 28 (100.0) | 17 (100.0) | 45 (100.0) | - |
| Dinner | 1 (3.6) | 0 (0.0) | 1 (2.2) | > 0.999 |
| Food cost per meal (KRW) | ||||
| < 3,000 | 6 (21.4) | 4 (23.5) | 10 (22.2) | > 0.999 |
| ≥ 3,000 | 22 (78.6) | 13 (76.5) | 35 (77.8) | |
| Mean | 3,517 ± 665.72 | 3,211 ± 1027.06 | 3,402 ± 823.44 | 0.231 |
| Number of cooks | ||||
| 1 | 16 (57.1) | 8 (47.1) | 24 (53.3) | 0.590 |
| 2 | 8 (28.6) | 8 (47.1) | 16 (35.6) | |
| 3 | 2 (7.1) | 1 (5.9) | 3 (6.7) | |
| ≥ 4 | 2 (7.1) | 0 (0.0) | 2 (4.4) | |
| Mean | 1.68 ± 1.02 | 1.59 ± 0.61 | 1.64 ± 0.80 | 0.774 |
| Meals served per cook |
104.51 ± 35.52 | 135.05 ± 68.45 | 116.04 ± 52.02 | 0.055 |
| Number of food service support staff (excluding cooks) | ||||
| 1–2 | 7 (25.0) | 1 (5.9) | 8 (17.8) | 0.083 |
| 3–4 | 9 (32.1) | 3 (17.6) | 12 (26.7) | |
| ≥ 5 | 12 (42.9) | 13 (76.5) | 25 (55.6) | |
| Mean | 4.86 ± 3.56 | 6.53 ± 2.52 | 5.49 ± 3.29 | 0.020 |
| Variables | Low-understanding (n = 28) | High-understanding (n = 17) | Total (n = 45) | P-value |
|---|---|---|---|---|
| Primary consideration in menu planning |
||||
| User preferences | 12 (42.9) | 8 (47.1) | 20 (44.4) | 0.858 |
| Budget | 10 (35.7) | 4 (23.5) | 14 (31.1) | |
| Nutritional requirements | 3 (10.7) | 2 (11.8) | 5 (11.1) | |
| Seasonal factors | 2 (7.1) | 1 (5.9) | 3 (6.7) | |
| Ease of food preparation | 1 (3.6) | 2 (11.8) | 3 (6.7) | |
| Importance in menu planning for developmental disabilities |
||||
| Food preferences and acceptability | 4.07 ± 0.76 | 4.53 ± 0.51 | 4.24 ± 0.71 | 0.048 |
| Appropriate food size | 3.75 ± 0.92 | 4.00 ± 0.79 | 3.84 ± 0.87 | 0.466 |
| Appropriate food temperature | 3.82 ± 0.77 | 4.00 ± 0.61 | 3.89 ± 0.71 | 0.528 |
| Dietary restrictions | 3.29 ± 1.04 | 3.71 ± 0.92 | 3.44 ± 1.01 | 0.180 |
| Visual presentation of meals | 4.04 ± 0.79 | 4.29 ± 0.68 | 4.13 ± 0.75 | 0.296 |
| Variables | Low-understanding (n = 2) | High-understanding (n = 3) | Total (n = 5) | P-value |
|---|---|---|---|---|
| Frequency of nutrition education (per year) | ||||
| Once | 2 (100.0) | 2 (66.7) | 4 (80.0) | > 0.999 |
| 12 times | 0 (0.0) | 1 (33.3) | 1 (20.0) | |
| Duration of nutrition education (min) | ||||
| 10–29.9 | 1 (50.0) | 0 (0.0) | 1 (20.0) | > 0.999 |
| 30–59.9 | 1 (50.0) | 2 (66.7) | 3 (60.0) | |
| ≥ 60 | 0 (0.0) | 1 (33.3) | 1 (20.0) | |
| Type of nutrition education |
||||
| Lecture-based education | 2 (100.0) | 3 (100.0) | 5 (100.0) | - |
| Experiential education | 0 (0.0) | 3 (100.0) | 3 (60.0) | 0.100 |
| Video-based education | 0 (0.0) | 2 (66.7) | 2 (40.0) | 0.400 |
| Education using visual materials | 1 (50.0) | 1 (33.3) | 2 (40.0) | > 0.999 |
| Regular provision of nutrition information | 1 (50.0) | 0 (0.0) | 1 (20.0) | 0.400 |
| Others | 1 (50.0) | 0 (0.0) | 1 (20.0) | > 0.999 |
| Topics of nutrition education |
||||
| Diet-related diseases and obesity | 0 (0.0) | 2 (66.7) | 2 (40.0) | 0.400 |
| Food refusal and nutritional deficiencies | 0 (0.0) | 1 (33.3) | 1 (20.0) | > 0.999 |
| Picky eating | 0 (0.0) | 3 (100.0) | 3 (60.0) | 0.100 |
| Others | 2 (100.0) | 0 (0.0) | 2 (40.0) | > 0.999 |
| Difficulties in providing nutrition education |
||||
| Lack of appropriate teaching methods | 0 (0.0) | 1 (33.3) | 1 (20.0) | > 0.999 |
| Communication difficulties | 1 (50.0) | 0 (0.0) | 1 (20.0) | |
| Challenging behaviors | 0 (0.0) | 1 (33.3) | 1 (20.0) | |
| Lack of education materials | 1 (50.0) | 1 (33.3) | 2 (40.0) |
| Variables |
Low-understanding (n = 26) | High-understanding (n = 14) | Total (n = 40) | P-value |
|---|---|---|---|---|
| Reasons for not implementing nutrition education1) | ||||
| Lack of knowledge about developmental disabilities | 6 (23.1) | 2 (14.3) | 8 (20.0) | 0.852 |
| Lack of educational materials | 3 (11.5) | 1 (7.1) | 4 (10.0) | |
| Insufficient time | 8 (30.8) | 5 (35.7) | 13 (32.5) | |
| Low awareness of the importance of nutrition education | 1 (3.8) | 2 (14.3) | 3 (7.5) | |
| Perceived low effectiveness of nutrition education | 6 (23.1) | 3 (21.4) | 9 (22.5) | |
| Others | 2 (7.7) | 1 (7.2) | 3 (7.5) | |
| Educational topic needs | ||||
| Food preoccupation and obesity | 7 (26.9) | 8 (57.1) | 15 (37.5) | 0.333 |
| Food refusal and nutritional imbalance | 4 (15.4) | 1 (7.1) | 5 (12.5) | |
| Picky eating | 14 (53.8) | 5 (35.8) | 19 (47.5) | |
| Others | 1 (3.9) | 0 (0.0) | 1 (2.5) | |
| Support needs for nutrition education implementation | ||||
| Provision of educational materials | 17 (65.4) | 8 (57.1) | 25 (62.5) | 0.581 |
| Training programs for nutrition education | 5 (19.2) | 3 (21.4) | 8 (20.0) | |
| Development of educational guidelines | 4 (15.4) | 2 (14.3) | 6 (15.0) | |
| Improving awareness among facility managers | 0 (0.0) | 1 (7.2) | 1 (2.5) |
| Variables |
Low-understanding (n = 28) | High-understanding (n = 17) | Total (n = 45) | P-value |
|---|---|---|---|---|
| Perceived need for nutrition education | ||||
| Need for nutritional improvement | 3.82 ± 0.72 | 4.12 ± 0.69 | 3.93 ± 0.72 | 0.198 |
| Need for nutrition education | 3.50 ± 0.63 | 4.00 ± 0.70 | 3.69 ± 0.70 | 0.032 |
| Effectiveness of nutrition education | 3.11 ± 0.78 | 3.35 ± 0.93 | 3.20 ± 0.84 | 0.387 |
| Perceived importance of job competencies | ||||
| Nutrition counseling skills | 3.82 ± 0.81 | 4.12 ± 0.60 | 3.93 ± 0.75 | 0.242 |
| Understanding of characteristics of developmental disabilities | 4.25 ± 0.79 | 4.24 ± 0.56 | 4.24 ± 0.71 | 0.687 |
| Communication skills | 4.07 ± 0.76 | 4.24 ± 0.66 | 4.13 ± 0.72 | 0.526 |
| Rapport-building skills | 3.96 ± 0.74 | 4.41 ± 0.61 | 4.13 ± 0.72 | 0.039 |
| Situational response skills | 3.89 ± 0.62 | 4.35 ± 0.60 | 4.07 ± 0.65 | 0.018 |
| Ability to develop nutrition education materials | 3.93 ± 0.66 | 4.12 ± 0.60 | 4.00 ± 0.64 | 0.377 |
| Mean | 3.98 ± 0.63 | 4.24 ± 0.50 | 4.08 ± 0.59 | 0.164 |
Table 1. General characteristics of participants
n (%) or Mean ± SD. Low- and high-understanding groups were classified based on the median score of the developmental disability understanding scale (mean score of 6 items; median = 3.0).
Table 2. Participants’ understanding of developmental disability characteristics
Mean ± SD. Low- and high-understanding groups were classified based on the median score of the developmental disability understanding scale (mean score of 6 items; median = 3.0). Measured using a 5-point Likert scale based on self-reported ability to explain each item (1 = strongly disagree, 5 = strongly agree).
Table 3. Characteristics of service users in the surveyed facilities
n (%). Low- and high-understanding groups were classified based on the median score of the developmental disability understanding scale (mean score of 6 items; median = 3.0). Multiple responses allowed; categories indicate facilities with at least one service user with the respective disability. Respondents were asked to select one primary disability type representing the largest proportion of service users. Includes intellectual disability and autism spectrum disorder.
Table 4. Food service operational characteristics of the surveyed facilities
n (%) or Mean ± SD. Low- and high-understanding groups were classified based on the median score of the developmental disability understanding scale (mean score of 6 items; median = 3.0). Daily number of meals served includes all meal recipients (e.g., service users, staff, and others). Daily number of meals served to service users refers to meals provided to individuals with disabilities only. Multiple responses allowed. Calculated as the total number of meals served divided by the number of cooks.
Table 5. Primary considerations in menu planning and perceived importance of menu-planning factors for individuals with developmental disabilities
n (%) or Mean ± SD. Low- and high-understanding groups were classified based on the median score of the developmental disability understanding scale (mean score of 6 items; median = 3.0). Participants were asked to select the single most important consideration in menu planning. Importance of each factor in menu planning for individuals with developmental disabilities was assessed using a 5-point Likert scale (1 = strongly disagree, 5 = strongly agree).
Table 6. Current status of nutrition education practices in facilities implementing nutrition education
n (%) or Mean ± SD. Low- and high-understanding groups were classified based on the median score of the developmental disability understanding scale (mean score of 6 items; median = 3.0). Multiple responses allowed. Participants were asked to select the single largest difficulty.
Table 7. Reasons for not implementing nutrition education and related educational needs for individuals with developmental disabilities
n (%). Low- and high-understanding groups were classified based on the median score of the developmental disability understanding scale (mean score of 6 items; median = 3.0). For each domain, participants were asked to select the single most important item.
Table 8. Perceptions of the need for nutrition education and importance of job competencies for individuals with developmental disabilities
Mean ± SD. Low- and high-understanding groups were classified based on the median score of the developmental disability understanding scale (mean score of 6 items; median = 3.0). 5-point Likert scale (1 = strongly disagree, 5 = strongly agree).


