
 KSCN
KSCN
Articles
- Page Path
- HOME > Korean J Community Nutr > Volume 31(4); 2026 > Article
-
Research Article
- Development of a nutrition program for Koreans with type 2 diabetes based on the health belief model: a pre-post intervention study
-
Kyoung-Min Lee1),2),*
 , EunSeok Cha3),*, Han-Sol Park4), Min-Sun Jeon5),6),†
 -
Korean Journal of Community Nutrition 2026;31(4):309-327.
DOI: https://doi.org/10.5720/kjcn.2026.00234
Published online: August 31, 2026
1)Ph.D. Student, Department of Food and Nutrition, Chungnam National University, Daejeon, Korea
2)Ph.D. Student, Major of Glocal Life-Care Convergence, Chungnam National University, Daejeon, Korea
3)Professor, Department of Nursing, Chungnam National University, Daejeon, Korea
4)M.S. Student, Department of Food and Nutrition, Chungnam National University, Daejeon, Korea
5)Professor, Department of Food and Nutrition, Chungnam National University, Daejeon, Korea
6)Professor, Interdisciplinary Education Center for the Innovative Next Generation Leaders in Glocal Lifecare, Chungnam National University, Daejeon, Korea
- †Corresponding author: Min-Sun Jeon Department of Food and Nutrition, Chungnam National University, 99 Daehak-ro, Yuseong-gu, Daejeon 34134, Korea Tel: +82-42-821-6836 Fax: +82-42-821-3335 Email: dearms@cnu.ac.kr
• Received: June 23, 2026 • Revised: July 10, 2026 • Accepted: July 22, 2026
© 2026 The Korean Society of Community Nutrition
This is an Open-Access article distributed under the terms of the Creative Commons Attribution Non-Commercial License (https://creativecommons.org/licenses/by-nc/4.0) which permits unrestricted non-commercial use, distribution, and reproduction in any medium, provided the original work is properly cited.
- 216 Views
- 10 Download


Abstract
-
Objectives
- To evaluate the effectiveness of a health belief model (HBM)-based nutrition education program in improving dietary behaviors, nutrition knowledge, and self-management among Koreans with type 2 diabetes mellitus (T2DM), and to examine age-related differences and the effects of intervention delivery strategies.
-
Methods
- A pre–post intervention study was conducted among 21 adults with T2DM (glycated hemoglobin levels ≥ 7.5%) attending outpatient clinics at university hospitals in Korea. The HBM-based program incorporated passive learning strategies (lectures and videos) and active, experiential learning strategies. Nutrition knowledge, dietary attitudes, and dietary behaviors were assessed before and after the intervention. Participants’ interest and satisfaction were also evaluated using interest–satisfaction analysis (ISA).
-
Results
- Nutrition knowledge and dietary behaviors improved significantly among adults following the intervention. Adults (n = 15) showed significant increases in nutrition knowledge (0.50 to 0.60, P < 0.05) and dietary behavior scores (2.26 to 2.47, P < 0.05), whereas no significant changes were observed among older adults (n = 6). The mean interest and satisfaction scores were 4.44 and 4.43 out of 5, respectively. Experiential learning strategies were associated with higher satisfaction than passive approaches. ISA showed that hands-on activities received the highest interest and satisfaction ratings, whereas passive methods were rated less favorably.
-
Conclusion
- Participation in an HBM-based nutrition education program was associated with improved dietary behaviors among Koreans with T2DM in a clinical nutrition setting. Experiential learning approaches appeared to be more effective than passive methods, and the age-related differences observed suggest a need for tailored intervention strategies. These findings support the development of scalable, patient-centered nutrition interventions for chronic disease management.
INTRODUCTION
METHODS
RESULTS
DISCUSSION
-
CONFLICT OF INTEREST
There are no financial or other issues that might lead to a conflict of interest.
-
FUNDING
This work was supported by the National Research Foundation of Korea (NRF) grant funded by the Korean government (NRF-2019R1A2C1087199; PI: E. Cha).
-
ACKNOWLEDGEMENTS
The authors acknowledge the valuable contributions of all participants and staff involved in this study.
-
DATA AVAILABILITY
The research data are available from the corresponding author upon reasonable request.
NOTES


Fig. 3.Interest–satisfaction analysis matrices for nutrition education attributes by content and delivery method. Each point represents the mean perceived interest score (x-axis) and satisfaction score (y-axis), measured on a 5-point Likert scale ranging from 1 (not at all interested/satisfied) to 5 (very interested/satisfied). The horizontal and vertical reference lines indicate the grand mean scores. (A) In the content-based analysis, the quadrants were defined using a grand mean interest score of 4.44 and a grand mean satisfaction score of 4.43. (B) In the delivery method analysis, the quadrants were defined using grand mean scores of 4.45 for both interest and satisfaction. The matrices were divided into four strategic quadrants: Quadrant I (Keep it up), representing high interest and high satisfaction; Quadrant II (Concentrate here), representing low interest and high satisfaction; Quadrant III (Low priority), representing low interest and low satisfaction; and Quadrant IV (Possible overkill), representing high interest and low satisfaction relative to the grand means (A, B). GI, glycemic index.

Fig. 4.Mean interest and satisfaction scores for nutrition education delivery methods by age group. (A) Interest and (B) satisfaction were rated on a 5-point Likert scale (1 = not at all, 5 = very much). PPT, PowerPoint presentation; Video, multimedia video-based instruction; Experiential, hands-on experiential learning; Game, gamified educational activities; Mean, composite mean score.

Table 1.Content and delivery strategies of a behavioral intervention program for individuals with T2DM based on the HBM
Table 2.Development of nutrition education cards and videos
| Themes | Content | Cards | Videos |
|---|---|---|---|
| GI animation | Definition of GI |
  
|

|
| Blood glucose response to high-GI foods | |||
| Blood glucose response to low-GI foods | |||
| Examples of high-GI foods | |||
| Examples of low-GI foods | |||
| Recommended daily intake 80:20 rule1) | |||
| Exchange system | Definition of the food exchange system |
 
|

|
| Interchangeable portions | |||
| Recommendations for variety in food exchanges | |||
| Beverage selection | Sugar content in carbonated and vitamin-fortified beverages |
  
|

|
| Nutrition facts of carbonated and vitamin-fortified beverages | |||
| Composition of freshly squeezed fruit juices | |||
| Sugar content in fruit juices | |||
| Nutrition labels of commercially available fruit juices | |||
| Sugar content in mixed coffee (prepackaged coffee) | |||
| Comparison of sugar content: mixed coffee vs. Americano | |||
| Sodium reduction | Self-assessment test for habitual high-sodium intake |
   
|

|
| Strategies for reducing sodium intake: product selection, nutrition labels, cooking methods, low-sodium cooking, dietary habits |
Table 3.Sociodemographic characteristics of study participants (n = 21)
Table 4.Effects of the behavioral intervention program on nutrition knowledge by age group
Mean ± SD.
Nutrition knowledge was assessed using 15 multiple-choice questions, with 1 point awarded for each correct answer; higher scores indicated greater nutrition knowledge.
Each item was scored as correct (1) or incorrect, including “don’t know” responses (0). The mean score for each item represents the proportion of correct responses, and the total score represents the mean proportion of correct responses across the 15 items. Higher scores indicate greater nutrition knowledge.
P-values were calculated using the Wilcoxon signed-rank test.
Table 5.Effects of the behavioral intervention program on dietary behaviors by age group
Table 6.Effects of the behavioral intervention program on dietary attitudes by age group
- 1. American Diabetes Association Professional Practice Committee. 10. Cardiovascular disease and risk management: standards of care in diabetes-2025. Diabetes Care 2025; 48(1 Suppl 1): S207-S238. ArticlePubMedPMC
- 2. Zheng Y, Ley SH, Hu FB. Global aetiology and epidemiology of type 2 diabetes mellitus and its complications. Nat Rev Endocrinol 2018; 14(2): 88-98. ArticlePubMedPMCPDF
- 3. Genitsaridi I, Salpea P, Salim A, Sajjadi SF, Tomic D, James S, et al. 11th edition of the IDF Diabetes Atlas: global, regional, and national diabetes prevalence estimates for 2024 and projections for 2050. Lancet Diabetes Endocrinol 2026; 14(2): 149-156. ArticlePubMed
- 4. Park SE, Ko SH, Kim JY, Kim K, Moon JH, Kim NH, et al. Diabetes fact sheets in Korea 2024. Diabetes Metab J 2025; 49(1): 24-33. ArticlePubMedPMCPDF
- 5. Korean Diabetes Association (KDA). Diabetes fact sheet in Korea 2024 [Internet]. KDA; 2024 [cited 2025 Oct 8]. Available from: https://www.diabetes.or.kr/bbs/?code=fact_sheet&mode=view&number=2792
- 6. Choi YJ, Lee MS, An SY, Kim TH, Han SJ, Kim HJ, et al. The relationship between diabetes mellitus and health-related quality of life in Korean adults: the fourth Korea National Health and Nutrition Examination Survey (2007-2009). Diabetes Metab J 2011; 35(6): 587-594. ArticlePubMedPMC
- 7. Jang SM, Park YJ, Choi GA. The lives of young adults with diabetes - focusing on diabetes self-management experiences and meaning -. Korean J Soc Welf 2025; 77(2): 69-94. Article
- 8. Yoo B. The role of diabetes educators in improving diabetes health literacy. J Korean Diabetes 2025; 26(2): 108-111. ArticlePDF
- 9. Kang HJ. Current status and effects of nutrition education programs for diabetic patients in Korea. J Korean Diabetes 2018; 19: 106-112. ArticleLink
- 10. Molina-Sotomayor E, Onetti-Onetti W, Castillo-Rodríguez A, González-Jurado JA. Changes in cognitive function and in the levels of glycosylated haemoglobin (HbA1c) in older women with type 2 diabetes mellitus subjected to a cardiorespiratory exercise programme. Sustainability 2020; 12(12): 5038.Article
- 11. Montevirgen R, Mendoza KB, Lopez LK. The impact of the Filipino plate method versus standard nutrition education on food group proportions and 2-hour postprandial blood glucose for type 2 diabetes. J ASEAN Fed Endocr Soc 2021; 36(2): 142-148. ArticlePubMedPMC
- 12. Powers MA, Bardsley JK, Cypress M, Funnell MM, Harms D, Hess-Fischl A, et al. Diabetes self-management education and support in adults with type 2 diabetes: a consensus report of the American Diabetes Association, the Association of Diabetes Care & Education Specialists, the Academy of Nutrition and Dietetics, the American Academy of Family Physicians, the American Academy of PAs, the American Association of Nurse Practitioners, and the American Pharmacists Association. J Am Pharm Assoc (2003) 2020; 60(6): e1-e18. ArticlePubMedPMC
- 13. Yang DH. The guide line for the stress management of the diabetes. Korean Clin Diabetes J 2010; 11(3): 215-219. ArticleLink
- 14. Park GS, Ly SY. Compliance and need assessment for diet therapy among diabetics and their caregivers. Korean J Community Nutr 2003; 8(1): 91-101.
- 15. Khunti K, Gomes MB, Pocock S, Shestakova MV, Pintat S, Fenici P, et al. Therapeutic inertia in the treatment of hyperglycaemia in patients with type 2 diabetes: a systematic review. Diabetes Obes Metab 2018; 20(2): 427-437. ArticlePubMedPMCLink
- 16. Evert AB, Dennison M, Gardner CD, Garvey WT, Lau KHK, MacLeod J, et al. Nutrition therapy for adults with diabetes or prediabetes: a consensus report. Diabetes Care 2019; 42(5): 731-754. ArticlePubMedPMCPDF
- 17. Lim EJ, Kim MJ, Han JS. Effects of nutrition education on improvement of blood glucose in type 2 diabetic patients with low income. J Korean Soc Food Sci Nutr 2014; 43(1): 141-150. Article
- 18. Chrvala CA, Sherr D, Lipman RD. Diabetes self-management education for adults with type 2 diabetes mellitus: a systematic review of the effect on glycemic control. Patient Educ Couns 2016; 99(6): 926-943. ArticlePubMed
- 19. Gebreyesus HA, Abreha GF, Beshirie SD, Abera MA, Weldegerima AH, Bezabih AM, et al. Patient-centered nutrition education improved the eating behavior of persons with uncontrolled type 2 diabetes mellitus in North Ethiopia: a quasi-experimental study. Front Nutr 2024; 11: 1352963.ArticlePubMedPMC
- 20. Michie S, van Stralen MM, West R. The behaviour change wheel: a new method for characterising and designing behaviour change interventions. Implement Sci 2011; 6: 42.ArticlePubMedPMCPDF
- 21. Mayer RE. Applying the science of learning to medical education. Med Educ 2010; 44(6): 543-549. ArticlePubMed
- 22. Contento IR, Koch PA. Nutrition education: linking research, theory, and practice. 4th ed. Jones & Bartlett Learning; 2021. p. 102-136.
- 23. Carpenter CJ. A meta-analysis of the effectiveness of health belief model variables in predicting behavior. Health Commun 2010; 25(8): 661-669. ArticlePubMed
- 24. Alpaugh M, Pope L, Trubek A, Skelly J, Harvey J. Cooking as a health behavior: examining the role of cooking classes in a weight loss intervention. Nutrients 2020; 12(12): 3669.ArticlePubMedPMC
- 25. Domper J, Gayoso L, Goni L, Perezábad L, Razquin C, de la O V, et al. An intensive culinary intervention programme to promote healthy ageing: the SUKALMENA-InAge feasibility pilot study. Nutrients 2024; 16(11): 1735.ArticlePubMedPMC
- 26. Hildebrand JA, Billimek J, Lee JA, Sorkin DH, Olshansky EF, Clancy SL, et al. Effect of diabetes self-management education on glycemic control in Latino adults with type 2 diabetes: a systematic review and meta-analysis. Patient Educ Couns 2020; 103(2): 266-275. ArticlePubMedPMC
- 27. Gyeonggi Center for Hypertension and Diabetes. Education and counseling manual for practitioners on hypertension and diabetes. Gyeonggi Center for Hypertension and Diabetes; 2020.
- 28. Korea Health Promotion Institute. 2022 12-week nutrition program for patients with hypertension and diabetes. Korea Health Promotion Institute; 2022.
- 29. Jones CJ, Smith H, Llewellyn C. Evaluating the effectiveness of health belief model interventions in improving adherence: a systematic review. Health Psychol Rev 2014; 8(3): 253-269. ArticlePubMed
- 30. Hood KK, Hilliard M, Piatt G, Ievers-Landis CE. Effective strategies for encouraging behavior change in people with diabetes. Diabetes Manag (Lond) 2015; 5(6): 499-510. ArticlePubMedPMC
- 31. Yardley S, Teunissen PW, Dornan T. Experiential learning: transforming theory into practice. Med Teach 2012; 34(2): 161-164. ArticlePubMed
- 32. Kwon YW. Development and validation of an evaluation instrument to measure diabetic patients' compliance with diet therapy. [master's thesis]. Seoul National University; 2009.
- 33. Ramadas A, Chan CKY, Quek KF, Hussein Z, Oldenburg BF. Validation of a knowledge, attitude, and behavior questionnaire for dietary education in Malaysian diabetic patients. Int J Behav Med 2010; 17(Suppl 1): 154-155.
- 34. Neves FJ, Tomita LY, Liu ASLW, Andreoni S, Ramos LR. Educational interventions on nutrition among older adults: a systematic review and meta-analysis of randomized clinical trials. Maturitas 2020; 136: 13-21. ArticlePubMed
- 35. Powers MA, Bardsley J, Cypress M, Duker P, Funnell MM, Fischl AH, et al. Diabetes self-management education and support in type 2 diabetes: a joint position statement of the American Diabetes Association, the American Association of Diabetes Educators, and the Academy of Nutrition and Dietetics. J Acad Nutr Diet 2015; 115(8): 1323-1334. ArticlePubMed
- 36. Contento IR. Nutrition education: linking research, theory, and practice. Asia Pac J Clin Nutr 2008; 17 Suppl 1: 176-179. PubMed
- 37. Worsley A. Nutrition knowledge and food consumption: can nutrition knowledge change food behaviour? Asia Pac J Clin Nutr 2002; 11 Suppl 3: S579-S585. ArticlePubMedLink
- 38. Davis R, Campbell R, Hildon Z, Hobbs L, Michie S. Theories of behaviour and behaviour change across the social and behavioural sciences: a scoping review. Health Psychol Rev 2015; 9(3): 323-344. ArticlePubMedPMC
- 39. Sharifirad G, Entezari MH, Kamran A, Azadbakht L. The effectiveness of nutritional education on the knowledge of diabetic patients using the health belief model. J Res Med Sci 2009; 14(1): 1-6. PubMedPMC
- 40. Bloom I, Lawrence W, Barker M, Baird J, Dennison E, Sayer AA, et al. What influences diet quality in older people? A qualitative study among community-dwelling older adults from the Hertfordshire cohort study, UK. Public Health Nutr 2017; 20(15): 2685-2693. ArticlePubMedPMC
REFERENCES
Figure & Data
REFERENCES
Citations
Citations to this article as recorded by 
 Cite
Cite XML Download
- Figure
-
- We recommend
- Related articles
-
- Development and evaluation of play-based food and nutrition education materials for early childhood through sensory experiences: a pre-post observational study
- A pilot investigation of a combined food literacy and exercise program for college students: a one-group pre-post intervention study
- Impact of a public health center nutrition education program on patients with type 2 diabetes in a primary care-based chronic disease management project: a pilot intervention study
- Health-related quality of life and nutrient intake of the elderly with type 2 diabetes according to comorbidity burden: a cross-sectional study
- Sex differences in health-related quality of life among older Korean adults with type 2 diabetes mellitus: a cross-sectional study
Development of a nutrition program for Koreans with type 2 diabetes based on the health belief model: a pre-post intervention study


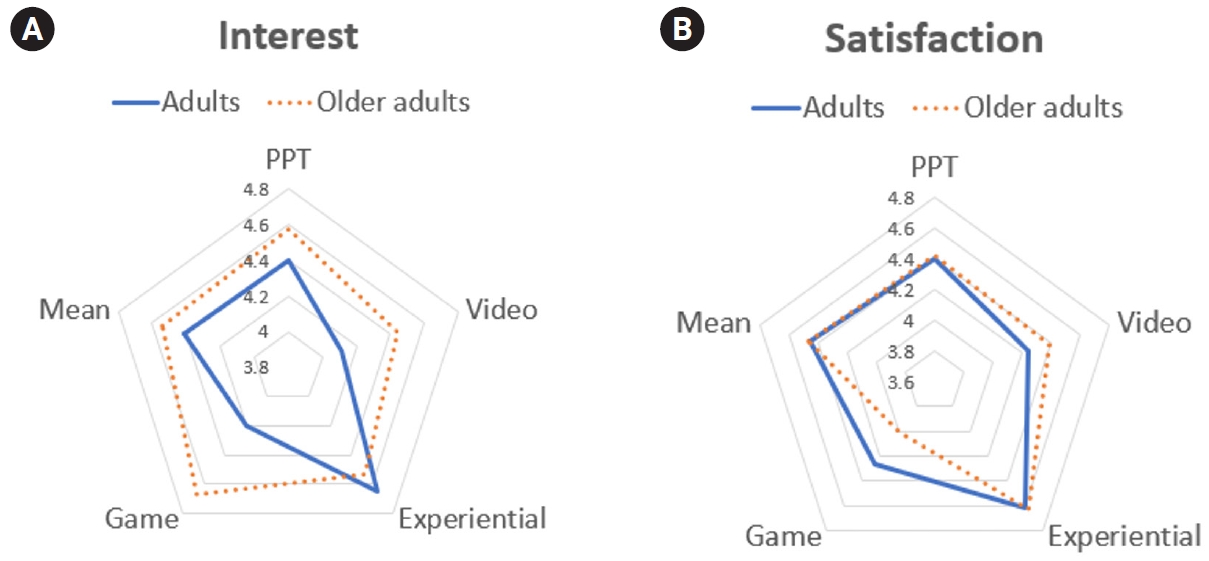
Fig. 1. Development and evaluation process for the behavioral intervention program.
Fig. 2. Participant recruitment and intervention flow for the behavioral intervention program.
Fig. 3. Interest–satisfaction analysis matrices for nutrition education attributes by content and delivery method. Each point represents the mean perceived interest score (x-axis) and satisfaction score (y-axis), measured on a 5-point Likert scale ranging from 1 (not at all interested/satisfied) to 5 (very interested/satisfied). The horizontal and vertical reference lines indicate the grand mean scores. (A) In the content-based analysis, the quadrants were defined using a grand mean interest score of 4.44 and a grand mean satisfaction score of 4.43. (B) In the delivery method analysis, the quadrants were defined using grand mean scores of 4.45 for both interest and satisfaction. The matrices were divided into four strategic quadrants: Quadrant I (Keep it up), representing high interest and high satisfaction; Quadrant II (Concentrate here), representing low interest and high satisfaction; Quadrant III (Low priority), representing low interest and low satisfaction; and Quadrant IV (Possible overkill), representing high interest and low satisfaction relative to the grand means (A, B). GI, glycemic index.
Fig. 4. Mean interest and satisfaction scores for nutrition education delivery methods by age group. (A) Interest and (B) satisfaction were rated on a 5-point Likert scale (1 = not at all, 5 = very much). PPT, PowerPoint presentation; Video, multimedia video-based instruction; Experiential, hands-on experiential learning; Game, gamified educational activities; Mean, composite mean score.
Fig. 1.
Fig. 2.
Fig. 3.
Fig. 4.
Development of a nutrition program for Koreans with type 2 diabetes based on the health belief model: a pre-post intervention study
| Session | Major theme | Subtheme | Factor | Content | Instructional materials |
|---|---|---|---|---|---|
| 1 | The three principles of healthy eating | Weight control methods | Perceived severity | - To delineate the current sex-specific prevalence of obesity in the Republic of Korea | - PowerPoint presentation |
| - To identify and elucidate the major determinants contributing to the development of obesity-related chronic diseases | - Handout (including BMI, waist circumference calculation sheet) | ||||
| Perceived benefits | - To recognize that maintaining an optimal (standard) body weight is associated with reduced risks of diabetes-related complications and other chronic diseases | - PowerPoint presentation | |||
| - To acknowledge that achieving a healthy body weight enables improved self-efficacy and supports a confident, health-promoting lifestyle | |||||
| Cues to action | - Calculation of BMI | - PowerPoint presentation | |||
| - Calculation of IBW | |||||
| - Estimation of daily energy requirements | |||||
| The three principles of healthy eating (balance, regularity, and appropriateness) | Perceived severity | - To assess the status of nutritional imbalance and the incidence of chronic diseases | - PowerPoint presentation | ||
| - To understand the increased risk of diabetic complications | - A spin wheel-based evaluation tool to assess dietary habits | ||||
| Perceived benefits | - To understand the metabolic regulation, prevention of constipation, and risk reduction of chronic diseases through adequate nutrient intake | - PowerPoint presentation | |||
| - To recognize the role of balanced dietary practices in maintaining overall nutritional health | |||||
| - To learn the prevention of hypoglycemia through regular meal consumption | |||||
| - To understand obesity prevention through appropriate dietary intake | |||||
| Self-efficacy | - To develop balanced meal plans using the food exchange system | - PowerPoint presentation | |||
| - To understand the concept of the food composition wheel for dietary planning and meal structuring | - Food models to understand appropriate individual portion sizes | ||||
| Distinguishing between low and high GI foods | Perceived severity | - To recognize factors that disrupt normal blood glucose levels | - PowerPoint presentation | ||
| - To understand the increased risk of hyperglycemia | |||||
| Perceived benefits | - To recognize strategies that reduce the risk of hyperglycemia | - A video clip on the GI | |||
| Self-efficacy | - To distinguish between foods with high and low GI using GI values | - Assessment tool to differentiate between high and low GI foods | |||
| - To understand how cooking methods affect GI | - Nutrition cards to summarize GI information | ||||
| 2 | Reduced sugar and sodium intake | Guidelines for appropriate sugar consumption | Perceived severity | - To investigate the consumption patterns of sweet and salty foods among older adults in Korea and their association with age-related increases in diabetes and hypertension prevalence | - PowerPoint presentation |
| - A taste assessment tool to evaluate sweet and salty taste perception | |||||
| Perceived benefits | - To recognize the maintenance of normal blood glucose levels | - PowerPoint presentation | |||
| - To recognize the reduction in the occurrence of diabetes-related complications | |||||
| - To understand preventive measures for hyperglycemia | |||||
| - To understand preventive measures for obesity and dental caries | |||||
| Self-efficacy | - To understand the recommended daily intake of sugars | - PowerPoint presentation | |||
| - To understand evidence-based strategies for appropriate sugar consumption, including interpreting nutrition labels, making informed food choices and preparations, and selecting beverages wisely | - A video clip on sugar intake | ||||
| Recommended strategies for appropriate sodium consumption | Perceived severity | - To recognize the increased risk of hypertension associated with excessive sodium intake | - PowerPoint presentation | ||
| Perceived benefits | - To recognize the maintenance of normal blood pressure | - PowerPoint presentation | |||
| - To recognize preventive measures for hypertension | |||||
| - To understand risk reduction for cardiovascular disease, gastritis, gastric cancer, and osteoporosis | |||||
| Self-efficacy | - To provide guidance on the equivalent amount of seasoning corresponding to 1 g of salt | - PowerPoint presentation | |||
| - To understand proper sodium consumption methods and strategies to support sodium excretion (potassium intake, magnesium intake, calcium intake) during cooking, food purchasing, and eating out | - A video clip on sodium intake |
| Themes | Content | Cards | Videos |
|---|---|---|---|
| GI animation | Definition of GI | ||
| Blood glucose response to high-GI foods | |||
| Blood glucose response to low-GI foods | |||
| Examples of high-GI foods | |||
| Examples of low-GI foods | |||
| Recommended daily intake 80:20 rule |
|||
| Exchange system | Definition of the food exchange system | ||
| Interchangeable portions | |||
| Recommendations for variety in food exchanges | |||
| Beverage selection | Sugar content in carbonated and vitamin-fortified beverages | ||
| Nutrition facts of carbonated and vitamin-fortified beverages | |||
| Composition of freshly squeezed fruit juices | |||
| Sugar content in fruit juices | |||
| Nutrition labels of commercially available fruit juices | |||
| Sugar content in mixed coffee (prepackaged coffee) | |||
| Comparison of sugar content: mixed coffee vs. Americano | |||
| Sodium reduction | Self-assessment test for habitual high-sodium intake | ||
| Strategies for reducing sodium intake: product selection, nutrition labels, cooking methods, low-sodium cooking, dietary habits |
| Classification | Value |
|---|---|
| Sex | |
| Male | 15 (71.4) |
| Female | 6 (28.6) |
| Age (year) | |
| 36–44 | 4 (19.0) |
| 45–54 | 2 (9.5) |
| 55–64 | 9 (42.9) |
| 65–74 | 6 (28.6) |
| Education level | |
| Less than high school | 7 (33.3) |
| High school graduate | 6 (28.6) |
| Currently enrolled in university | 1 (4.8) |
| University graduate | 5 (23.8) |
| Currently enrolled in graduate school | 0 (0.0) |
| Graduate school graduate or higher | 2 (9.5) |
| Household composition | |
| Alone | 4 (19.0) |
| Spouse | 13 (61.9) |
| Children | 11 (52.3) |
| Friends/acquaintances | 1 (4.8) |
| Others | 1 (4.8) |
| Smoking | |
| Yes | 4 (19.0) |
| No | 17 (81.0) |
| Alcohol intake | |
| Yes | 11 (52.4) |
| No | 10 (47.6) |
| Frequency of blood glucose monitoring | |
| ≥ 4 times/day | 0 (0.0) |
| 2–3 times/day | 3 (14.3) |
| 1 time/day | 9 (42.9) |
| ≥ 3 times/week | 2 (9.5) |
| 1–2 times/week | 3 (14.3) |
| Others | 4 (19.0) |
| Total | 21 (100.0) |
| Variables | Adults (n = 15) | Older adults (n = 6) | ||||||||
|---|---|---|---|---|---|---|---|---|---|---|
| Pre | Post | Δ (Post–pre) | P-value | Effect size (Cohen’s d) | Pre | Post | Δ (Post–pre) | P-value | Effect size (Cohen’s d) | |
| Goals of dietary therapy for diabetes | 0.07 ± 0.26 | 0.20 ± 0.41 | 0.13 ± 0.35 | 0.157 | 0.38 | 0.17 ± 0.41 | 0.33 ± 0.52 | 0.17 ± 0.75 | 0.564 | 0.49 |
| Foods that raise blood glucose the most | 0.80 ± 0.41 | 0.73 ± 0.46 | –0.07 ± 0.59 | 0.655 | 0.16 | 1.00 ± 0.00 | 0.83 ± 0.41 | –0.17 ± 0.41 | 0.317 | 0.59 |
| Foods that raise blood glucose the least | 0.47 ± 0.52 | 0.87 ± 0.35 | 0.40 ± 0.63 | 0.034 | 0.90 | 0.17 ± 0.41 | 0.67 ± 0.52 | 0.50 ± 0.55 | 0.083 | 1.07 |
| Foods that patients with diabetes can consume freely | 0.47 ± 0.52 | 0.67 ± 0.49 | 0.20 ± 0.86 | 0.366 | 0.40 | 0.50 ± 0.55 | 0.33 ± 0.52 | –0.17 ± 0.75 | 0.564 | 0.32 |
| Foods that cannot be consumed relatively freely | 0.47 ± 0.51 | 0.60 ± 0.51 | 0.13 ± 0.41 | 0.083 | 0.39 | 0.50 ± 0.55 | 0.33 ± 0.52 | –0.17 ± 0.75 | 0.564 | 0.32 |
| Foods with equivalent nutritional value to meat | 0.73 ± 0.46 | 0.80 ± 0.41 | 0.07 ± 0.46 | 0.564 | 0.16 | 0.83 ± 0.41 | 1.00 ± 0.00 | 0.17 ± 0.41 | 0.317 | 0.59 |
| Foods highest in fat content | 0.27 ± 0.46 | 0.27 ± 0.46 | 0.00 ± 0.66 | > 0.999 | 0.00 | 0.17 ± 0.41 | 0.17 ± 0.41 | 0.00 ± 0.00 | > 0.999 | 0.00 |
| Foods highest in carbohydrate content | 0.53 ± 0.52 | 0.67 ± 0.49 | 0.13 ± 0.35 | 0.157 | 0.28 | 0.50 ± 0.55 | 0.50 ± 0.55 | 0.00 ± 0.00 | > 0.999 | 0.00 |
| Basic principles of dietary therapy for diabetes | 0.87 ± 0.35 | 0.93 ± 0.26 | 0.07 ± 0.46 | 0.564 | 0.19 | 1.00 ± 0.00 | 0.50 ± 0.55 | –0.50 ± 0.55 | 0.083 | 1.29 |
| Dietary therapy for prevention of diabetic complications | 0.60 ± 0.51 | 0.80 ± 0.41 | 0.20 ± 0.78 | 0.180 | 0.43 | 0.50 ± 0.55 | 0.67 ± 0.52 | 0.17 ± 0.75 | 0.564 | 0.32 |
| Foods that can replace 140 g of cooked rice | 0.40 ± 0.51 | 0.60 ± 0.51 | 0.20 ± 0.78 | 0.317 | 0.39 | 0.33 ± 0.52 | 0.67 ± 0.52 | 0.33 ± 0.82 | 0.317 | 0.65 |
| Amounts of fruits or vegetables equivalent to 1 exchange unit of apple | 0.07 ± 0.26 | 0.07 ± 0.26 | 0.00 ± 0.38 | > 0.999 | 0.00 | 0.17 ± 0.41 | 0.00 ± 0.00 | –0.17 ± 0.41 | 0.317 | 0.58 |
| Foods that can replace 200 mL of whole milk | 0.40 ± 0.51 | 0.33 ± 0.49 | –0.07 ± 0.59 | 0.655 | 0.14 | 0.33 ± 0.52 | 0.67 ± 0.52 | 0.33 ± 0.52 | 0.157 | 0.65 |
| Appropriate snack intake | 0.80 ± 0.42 | 0.80 ± 0.41 | 0.00 ± 0.54 | > 0.999 | 0.00 | 0.50 ± 0.55 | 0.83 ± 0.41 | 0.33 ± 0.52 | 0.157 | 0.68 |
| Treatment and management of hypoglycemia | 0.67 ± 0.49 | 0.67 ± 0.49 | 0.00 ± 0.54 | > 0.999 | 0.00 | 0.33 ± 0.52 | 0.67 ± 0.52 | 0.33 ± 0.82 | 0.317 | 0.65 |
| Total | 0.50 ± 0.16 | 0.60 ± 0.14 | 0.10 ± 0.17 | 0.042 | 0.67 | 0.47 ± 0.16 | 0.54 ± 0.21 | 0.08 ± 0.18 | 0.257 | 0.37 |
| Variable | Adults (n = 15) | Older adults (n = 6) | ||||||||
|---|---|---|---|---|---|---|---|---|---|---|
| Pre | Post | Δ (Post–pre) | P-value | Effect size (Cohen’s d) | Pre | Post | Δ (Post–pre) | P-value | Effect size (Cohen’s d) | |
| Avoiding snacks at each meal and consuming appropriate meal portions | 2.80 ± 0.86 | 2.60 ± 0.63 | –0.20 ± 0.86 | 0.366 | 0.27 | 2.67 ± 1.21 | 3.17 ± 0.75 | 0.50 ± 1.38 | 0.414 | 0.50 |
| Eating three regular meals daily at 4–5 hour intervals | 2.67 ± 1.05 | 2.67 ± 0.90 | 0.00 ± 0.93 | > 0.999 | 0.00 | 3.33 ± 1.03 | 3.17 ± 0.98 | –0.17 ± 0.98 | 0.655 | 0.16 |
| Considering food exchanges during meals | 1.73 ± 0.70 | 1.93 ± 0.96 | 0.20 ± 1.01 | 0.453 | 0.24 | 1.83 ± 1.17 | 2.17 ± 0.75 | 0.33 ± 1.21 | 0.480 | 0.35 |
| Reducing intake of sugars during meals | 2.60 ± 0.74 | 2.67 ± 0.62 | 0.07 ± 0.59 | 0.655 | 0.10 | 2.67 ± 1.37 | 3.00 ± 0.89 | 0.33 ± 1.21 | 0.480 | 0.29 |
| Consuming appropriate amounts of grain-based foods | 2.53 ± 0.64 | 2.67 ± 0.49 | 0.13 ± 0.52 | 0.317 | 0.25 | 2.83 ± 1.17 | 3.17 ± 0.98 | 0.33 ± 1.03 | 0.414 | 0.32 |
| Reducing intake of snacks other than healthy options | 2.40 ± 0.74 | 2.60 ± 0.63 | 0.20 ± 0.86 | 0.408 | 0.29 | 2.83 ± 1.17 | 2.83 ± 1.17 | 0.00 ± 0.89 | > 0.999 | 0.00 |
| Consuming meat, fish, and other protein-rich side dishes at each meal | 1.87 ± 0.35 | 2.07 ± 0.59 | 0.20 ± 0.68 | 0.257 | 0.41 | 2.50 ± 0.84 | 2.50 ± 1.05 | 0.00 ± 0.63 | > 0.999 | 0.00 |
| Consuming sufficient vegetable side dishes at each meal | 2.33 ± 0.82 | 2.33 ± 0.72 | 0.00 ± 1.00 | > 0.999 | 0.00 | 2.83 ± 0.98 | 2.00 ± 0.63 | –0.83 ± 0.98 | 0.102 | 1.01 |
| Limiting fat intake at each meal | 2.13 ± 0.64 | 2.20 ± 0.56 | 0.07 ± 0.70 | 0.705 | 0.12 | 2.83 ± 0.98 | 2.00 ± 0.63 | –0.83 ± 0.75 | 0.059 | 1.01 |
| Limiting high-calorie and oily foods when eating out and eating balanced meals | 2.07 ± 0.80 | 2.40 ± 0.51 | 0.33 ± 0.98 | 0.190 | 0.49 | 2.33 ± 1.37 | 2.67 ± 1.03 | 0.33 ± 0.52 | 0.157 | 0.28 |
| Checking nutrition labels when selecting foods | 1.73 ± 0.70 | 2.27 ± 0.88 | 0.53 ± 0.83 | 0.033 | 0.68 | 2.00 ± 1.55 | 2.00 ± 1.55 | 0.00 ± 0.00 | > 0.999 | 0.00 |
| Abstaining from alcohol or consuming in moderation | 2.27 ± 1.28 | 3.20 ± 0.94 | 0.93 ± 1.62 | 0.072 | 0.83 | 3.00 ± 1.27 | 1.83 ± 1.33 | –1.17 ± 2.56 | 0.281 | 0.90 |
| Total | 2.26 ± 0.42 | 2.47 ± 0.28 | 0.21 ± 0.34 | 0.038 | 0.59 | 2.64 ± 0.89 | 2.54 ± 0.66 | –0.10 ± 0.67 | 0.916 | 0.13 |
| Variable | Adults (n = 15) | Older adults (n = 6) | ||||||||
|---|---|---|---|---|---|---|---|---|---|---|
| Pre | Post | Δ (Post–pre) | P-value | Effect size (Cohen’s d) | Pre | Post | Δ (Post–pre) | P-value | Effect size (Cohen’s d) | |
| Consuming meals in appropriate amounts at regular times is important for blood glucose control | 3.53 ± 0.52 | 3.67 ± 0.49 | 0.13 ± 0.52 | 0.317 | 0.28 | 3.33 ± 0.52 | 3.33 ± 0.52 | 0.00 ± 0.00 | > 0.999 | 0.00 |
| Timing meals and snacks according to insulin action is important | 3.27 ± 0.46 | 3.33 ± 0.62 | 0.07 ± 0.59 | 0.655 | 0.11 | 3.00 ± 0.63 | 3.17 ± 0.41 | 0.17 ± 0.41 | 0.317 | 0.32 |
| Using nutrition labels for dietary management is essential | 3.13 ± 0.35 | 3.40 ± 0.51 | 0.27 ± 0.46 | 0.046 | 0.62 | 2.50 ± 0.84 | 3.33 ± 0.52 | 0.83 ± 1.17 | 0.102 | 1.19 |
| Monitoring and limiting intake of simple sugars (candy, sugar, honey) is important | 3.27 ± 0.46 | 3.47 ± 0.64 | 0.20 ± 0.56 | 0.180 | 0.36 | 3.00 ± 0.63 | 3.00 ± 1.10 | 0.00 ± 1.27 | > 0.999 | 0.00 |
| Being cautious of foods high in sodium (salt, soy sauce, processed foods) is important | 3.27 ± 0.46 | 3.60 ± 0.51 | 0.33 ± 0.62 | 0.059 | 0.68 | 2.83 ± 0.75 | 3.17 ± 0.75 | 0.33 ± 1.03 | 0.414 | 0.40 |
| Being cautious of foods high in fat and cholesterol is important | 3.27 ± 0.46 | 3.47 ± 0.52 | 0.20 ± 0.56 | 0.180 | 0.41 | 3.00 ± 0.63 | 3.33 ± 0.52 | 0.33 ± 1.03 | 0.414 | 0.57 |
| Proper adherence to diabetes dietary therapy leads to effective blood glucose control | 3.47 ± 0.64 | 3.53 ± 0.52 | 0.07 ± 0.80 | 0.739 | 0.10 | 3.33 ± 0.52 | 3.67 ± 0.52 | 0.33 ± 0.82 | 0.317 | 0.65 |
| Diabetes dietary therapy is not difficult to follow | 3.07 ± 0.46 | 3.07 ± 0.70 | 0.00 ± 0.54 | > 0.999 | 0.00 | 3.33 ± 0.52 | 3.33 ± 0.52 | 0.00 ± 0.00 | > 0.999 | 0.00 |
| Consuming a balanced diet considering meal composition is important | 3.33 ± 0.52 | 3.40 ± 0.63 | 0.07 ± 0.70 | 0.705 | 0.12 | 3.17 ± 0.75 | 3.50 ± 0.55 | 0.33 ± 0.82 | 0.317 | 0.50 |
| Weight management is important for blood glucose control | 3.47 ± 0.52 | 3.53 ± 0.52 | 0.07 ± 0.46 | 0.564 | 0.12 | 3.17 ± 0.75 | 3.17 ± 0.41 | 0.00 ± 0.63 | > 0.999 | 0.00 |
| Reducing intake of unhealthy snacks is important | 3.40 ± 0.51 | 3.47 ± 0.52 | 0.07 ± 0.59 | 0.655 | 0.14 | 3.50 ± 0.55 | 3.33 ± 0.52 | –0.17 ± 0.41 | 0.317 | 0.32 |
| Consuming alcohol in appropriate amounts or abstaining is important for blood glucose control | 3.20 ± 0.56 | 3.53 ± 0.52 | 0.33 ± 0.62 | 0.059 | 0.72 | 3.50 ± 0.55 | 2.67 ± 1.03 | –0.83 ± 0.98 | 0.102 | 1.01 |
| Total | 3.31 ± 0.34 | 3.46 ± 0.41 | 0.15 ± 0.39 | 0.195 | 0.40 | 3.14 ± 0.33 | 3.25 ± 0.47 | 0.11 ± 0.39 | 0.673 | 0.27 |
Table 1. Content and delivery strategies of a behavioral intervention program for individuals with T2DM based on the HBM
T2DM, type 2 diabetes mellitus; HBM, health belief model; BMI, body mass index [body weight (kg)/height2 (m2)]; IBW, ideal body weight; GI, glycemic index.
Table 2. Development of nutrition education cards and videos
GI, glycemic index. 80:20 rule: A guideline balancing 80% health-focused food choices with 20% flexible dietary enjoyment.
Table 3. Sociodemographic characteristics of study participants (n = 21)
n (%). Household composition was assessed using multiple responses.
Table 4. Effects of the behavioral intervention program on nutrition knowledge by age group
Mean ± SD. Nutrition knowledge was assessed using 15 multiple-choice questions, with 1 point awarded for each correct answer; higher scores indicated greater nutrition knowledge. Each item was scored as correct (1) or incorrect, including “don’t know” responses (0). The mean score for each item represents the proportion of correct responses, and the total score represents the mean proportion of correct responses across the 15 items. Higher scores indicate greater nutrition knowledge.
Table 5. Effects of the behavioral intervention program on dietary behaviors by age group
Mean ± SD. Dietary behaviors were assessed using 12 items rated on a 4-point Likert scale (1 = strongly disagree, 4 = strongly agree); higher scores indicated more favorable dietary behaviors.
Table 6. Effects of the behavioral intervention program on dietary attitudes by age group
Mean ± SD. Dietary attitudes were assessed using 12 items rated on a 4-point Likert scale (1 = strongly disagree, 4 = strongly agree); higher scores indicated more favorable dietary attitudes.


