
Articles
- Page Path
- HOME > Korean J Community Nutr > Volume 31(2); 2026 > Article
-
Research Article
- Development of a simplified NOVA-based scoring tool for assessing ultra-processed food consumption among Korean young adults: a cross-sectional study
-
Jinhyun Kim1),2)
 , Eunjin Jang3), Sarang Jeong4),5), Sukyoung Jung6), Jee Young Kim7), Jung Eun Lee8),9), Dahye Han1),2), Eunseo Lee1),2), Junhyeok Jang1),2), Sohyun Park10),11),†
 -
Korean Journal of Community Nutrition 2026;31(2):140-152.
DOI: https://doi.org/10.5720/kjcn.2026.00059
Published online: April 30, 2026
1)Master Student, Department of Food Science and Nutrition, Hallym University, Chuncheon, Korea
2)Master Student, The Korean Institute of Nutrition, Hallym University, Chuncheon, Korea
3)Researcher, The Korean Institute of Nutrition, Hallym University, Chuncheon, Korea
4)Research Professor, Industry-Academy Collaboration Foundation, Dongduk Women’s University, Seoul, Korea
5)Research Fellow, The Korean Institute of Nutrition, Hallym University, Chuncheon, Korea
6)Associate Research Fellow, Department of Healthcare Policy Research, Korea Institute for Health and Social Affairs, Sejong, Korea
7)Ph. D., Jeju Jinsan Co., Seogwipo, Korea
8)Professor, Department of Food and Nutrition, College of Human Ecology, Seoul National University, Seoul, Korea
9)Professor, Research Institute of Human Ecology, College of Human Ecology, Seoul National University, Seoul, Korea
10)Professor, Department of Food Science and Nutrition, Hallym University, Chuncheon, Korea
11)Professor, The Korean Institute of Nutrition, Hallym University, Chuncheon, Korea
- †Corresponding author: Sohyun Park Department of Food Science and Nutrition, Hallym University, 1 Hallymdaehak-gil, Chuncheon 24252, Korea Tel: +82-33-248-2134 Fax: +82-33-256-3420 Email: sopark@hallym.ac.kr
• Received: February 2, 2026 • Revised: March 5, 2026 • Accepted: March 11, 2026
© 2026 The Korean Society of Community Nutrition
This is an Open-Access article distributed under the terms of the Creative Commons Attribution Non-Commercial License (https://creativecommons.org/licenses/by-nc/4.0) which permits unrestricted non-commercial use, distribution, and reproduction in any medium, provided the original work is properly cited.
- 641 Views
- 31 Download
Abstract
-
Objectives
- This study aimed to develop a NOVA-based scoring approach for evaluating ultra-processed food (UPF) intake among Korean adults and to examine its performance. Previous studies have reported that young adults have the highest levels of UPF consumption. Accordingly, this study focused on adults aged 19–40 years and developed scoring components reflecting dietary patterns specific to Korean eating habits.
-
Methods
- Using 24-hour dietary recall data from adults aged 19–40 years in the Korea National Health and Nutrition Examination Survey (2021–2023), foods were classified according to the Korean-adapted NOVA system. The top 10 food groups accounting for ≥ 80% of cumulative UPF-derived energy were selected to construct the scoring components. The tool was operationalized using food frequency questionnaire (FFQ) data from the Gangwon cohort study (2022–2024). Intake frequencies were converted into scores ranging from 0 (“rarely or never”) to 5 (“≥ 1 time/day”), and summed to generate the NOVA–UPF score (range: 0–50).
-
Results
- Among 237 young adults (aged 20–49 years), the mean NOVA–UPF score was 22.9 ± 8.3. A positive association was observed between the NOVA–UPF score and FFQ-based UPF energy intake (Spearman’s ρ = 0.629, P < 0.001). Cross-classification showed that 51.9% were classified into the same tertile and 94.9% into the same or adjacent tertiles, with a weighted kappa coefficient of 0.279.
-
Conclusion
- This NOVA-based scoring approach may serve as a preliminary tool for assessing UPF intake in Korean young adults. Further refinement and rigorous validation using quantitative dietary assessment methods and more diverse populations are required before broader application.
INTRODUCTION
METHODS
1) Identification of UPF food groups using 24-hour recall data
2) Scoring of the tool using the FFQ
3) Assessment of tool performance
RESULTS
DISCUSSION
-
CONFLICT OF INTEREST
There are no financial or other issues that might lead to a conflict of interest.
-
FUNDING
This research was supported by Basic Science Research Program through the National Research Foundation of Korea (NRF) funded by the Ministry of Education (RS-2021-NR060133). This study was supported by NRF grant funded by the Korean government (MSIT) (RS-2024-00343922). This study was supported by Research Grant (Grant No. KSSO-D-2025002) from Korean Society for the Study of Obesity. The funder had no role in the study design, data collection and analysis, decision to publish, or preparation of the manuscript.
-
ACKNOWLEDGEMENTS
The authors would like to express their sincere gratitude to all participants who took part in the GOMS cohort study.
This article is based on the master’s thesis of Jinhyun Kim submitted to the Graduate School of Hallym University, Department of Food Science and Nutrition.
-
DATA AVAILABILITY
The datasets generated and analyzed during the current study are not publicly available due to confidentiality agreements and the lack of explicit participant consent for data sharing.
NOTES
SUPPLEMENTARY MATERIALS
Supplementary Table 1.
Supplementary Table 2.
Fig. 1.Diagram of data analysis employed in the development and performance evaluation of the NOVA–UPF scoring tool. KNHANES, Korea National Health and Nutrition Examination Survey; FFQ, food frequency questionnaire; GOMS, Gangwon Obesity and Metabolic Syndrome; UPF, ultra-processed food.

Fig. 2.Cumulative contribution of UPF subgroups based on 24-hour dietary recall data among adults aged 19–40 years in the KNHANES (2021–2023) (n = 3,859). UPF, ultra-processed food; KNHANES, Korea National Health and Nutrition Examination Survey.
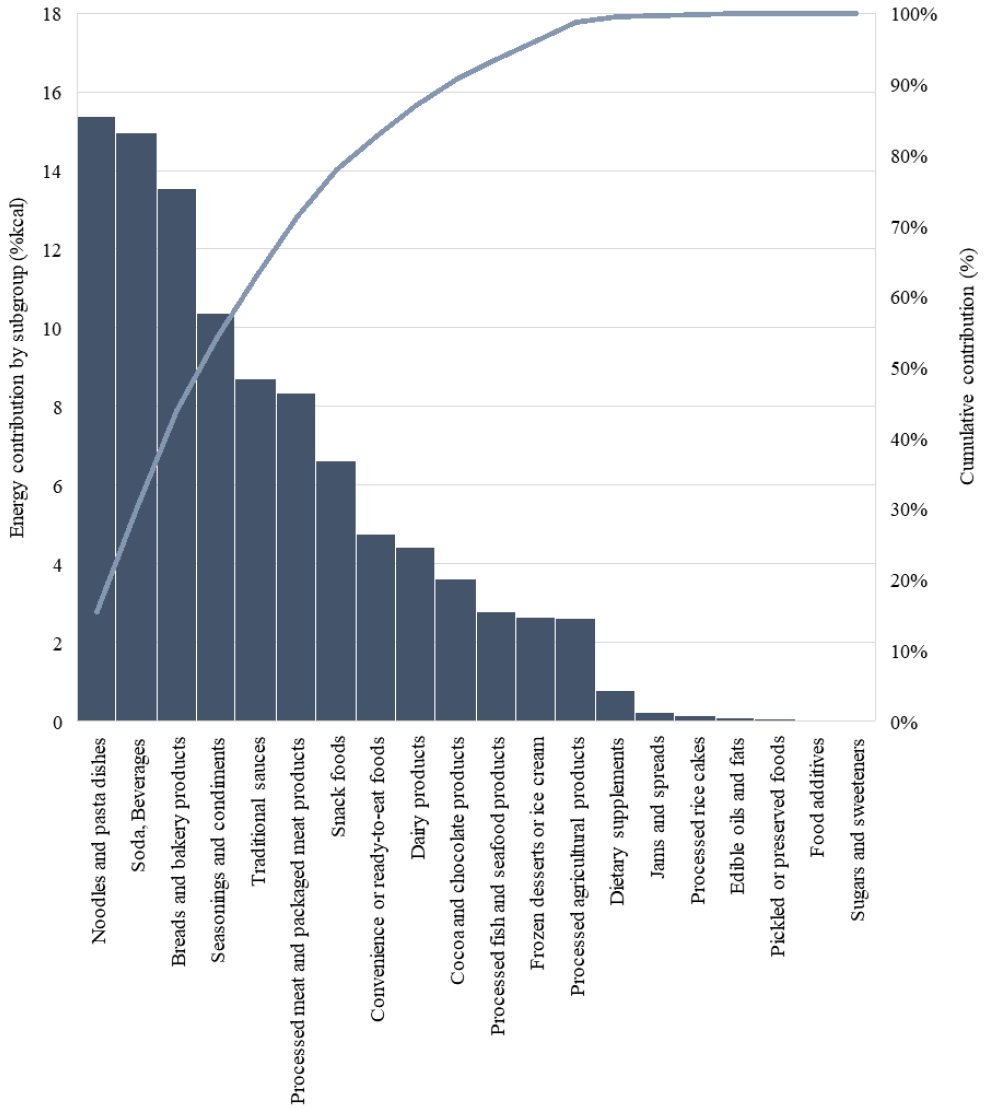
Table 1.Comparison of energy intake (%) from UPF subgroups according to gender among adults aged 19–40 years in the KNHANES (2021–2023) (n = 3,859)
Adjusted mean ± SE from multivariate regression models.
All values, except for the total energy intake, are expressed as %kcal/day.
All estimates were calculated using sampling weights to account for the complex survey design of KNHANES.
P-values indicate overall differences according to gender.
UPF, ultra-processed food; KNHANES, Korea National Health and Nutrition Examination Survey.
Table 2.Scoring criteria for NOVA–UPF items according to consumption frequency
Table 3.General characteristics of study participants according to gender based on FFQ data among adults aged 20–49 years in the GOMS cohort study (2022–2024) (n = 237)
| Variables | Total (n = 237) | Men (n = 65) | Women (n = 172) | P-value |
|---|---|---|---|---|
| Total | 237 (100.0) | 65 (27.4) | 172 (72.6) | |
| Marital status | 0.925 | |||
| Spouse, including common-law partner | 196 (82.7) | 54 (83.1) | 142 (82.6) | |
| Without a spouse1) | 41 (17.3) | 11 (16.9) | 30 (17.4) | |
| Education level | 0.011 | |||
| ≤ Middle school | 5 (2.1) | 0 (0.0) | 5 (2.9) | |
| High school | 73 (30.8) | 12 (18.5) | 61 (35.5) | |
| ≥ College | 159 (67.1) | 53 (81.5) | 106 (61.6) | |
| Household income per month (million KRW) | 0.913 | |||
| < 2 | 17 (7.2) | 4 (6.2) | 13 (7.6) | |
| 2–4 | 77 (32.5) | 22 (33.9) | 55 (32.0) | |
| > 4 | 143 (60.3) | 39 (60.0) | 104 (60.5) | |
| Household type (n = 236) | 0.976 | |||
| Single member | 22 (9.3) | 6 (9.2) | 16 (9.4) | |
| Non-single | 214 (90.7) | 59 (90.8) | 155 (90.6) | |
| Smoking status (n = 234) | < 0.001 | |||
| Never smoker2) | 171 (73.1) | 29 (45.3) | 142 (83.5) | |
| Former smoker | 25 (10.7) | 12 (18.8) | 13 (7.7) | |
| Current smoker | 38 (16.2) | 23 (35.9) | 15 (8.8) | |
| Drinking status | 0.287 | |||
| Current drinking | 182 (76.8) | 53 (81.5) | 129 (75.0) | |
| Current abstainer3) | 55 (23.2) | 12 (18.5) | 43 (25.0) | |
| Recommended PA levels4) | 0.160 | |||
| No PA Level | 104 (43.9) | 23 (35.4) | 81 (47.1) | |
| Insufficient or inactive PA levels | 49 (20.7) | 18 (27.7) | 31 (18.0) | |
| Recommended PA level | 84 (35.4) | 24 (36.9) | 60 (34.9) |
n (%).
P-values between groups were identified using chi-squared tests.
Sample sizes vary depending on the variables.
FFQ, food frequency questionnaire; GOMS, Gangwon Obesity and Metabolic Syndrome; PA, physical activity.
1)Without a spouse: individuals who are separated, divorced, widowed, or never married.
2)Never smokers: those who have smoked < 100 cigarettes over their lifetime.
3)Current abstainer: no lifetime experience of alcohol consumption or no alcohol intake during the past year.
4)Recommended PA level: engaging in at least 150 minutes per week of moderate-intensity physical activity or 75 minutes per week of vigorous-intensity physical activity.
Table 4.Mean NOVA–UPF scores according to general characteristics of participants in the GOMS cohort study (2022–2024) (n = 237)
| Variables | NOVA–UPF score | P-value |
|---|---|---|
| Age (year) | 0.610 | |
| 20–29 | 21.3 ± 7.1 | |
| 30–39 | 23.6 ± 8.7 | |
| 40–49 | 22.8 ± 8.3 | |
| Gender | 0.500 | |
| Men | 23.5 ± 8.6 | |
| Women | 22.6 ± 8.2 | |
| Marital status | 0.907 | |
| Spouse, including common-law partner | 22.9 ± 8.2 | |
| Without a spouse1) | 22.7 ± 8.7 | |
| Education level | 0.259 | |
| ≤ Middle school | 24.8 ± 8.7 | |
| High school | 21.6 ± 8.2 | |
| ≥ College | 23.4 ± 8.3 | |
| Household income per month (million KRW) | 0.373 | |
| < 2 | 22.1 ± 10.0 | |
| 2–4 | 21.9 ± 7.8 | |
| > 4 | 23.5 ± 8.3 | |
| Household type | 0.388 | |
| Single member | 21.5 ± 10.0 | |
| Non-single | 23.1 ± 8.1 | |
| Smoking status | 0.343 | |
| Never smoker2) | 22.8 ± 8.3 | |
| Former smoker | 25.0 ± 9.4 | |
| Current smoker | 22.0 ± 7.6 | |
| Drinking status | 0.959 | |
| Current drinking | 22.9 ± 8.2 | |
| Current abstainer3) | 22.8 ± 8.7 | |
| Recommended PA levels4) | 0.584 | |
| No PA Level | 22.7 ± 8.7 | |
| Insufficient or inactive PA levels | 24.0 ± 7.4 | |
| Recommended PA level | 22.5 ± 8.3 |
Mean ± SD.
P-values were obtained from an independent t-test or one-way ANOVA.
UPF, ultra-processed food; GOMS, Gangwon Obesity and Metabolic Syndrome; PA, physical activity.
1)Without a spouse: individuals who are separated, divorced, widowed, or never married.
2)Never smokers: those who have smoked < 100 cigarettes over their lifetime.
3)Current abstainer: no lifetime experience of alcohol consumption or no alcohol intake during the past year.
4)Recommended PA level: engaging in at least 150 minutes per week of moderate-intensity physical activity or 75 minutes per week of vigorous-intensity physical activity.
Table 5.Cross-classification of participants by tertiles of UPF energy intake (%) and NOVA–UPF scores based on FFQ data in the GOMS cohort study (2022–2024) (n = 237)
- 1. Monteiro CA, Cannon G, Levy RB, Moubarac JC, Louzada ML, Rauber F, et al. Ultra-processed foods: what they are and how to identify them. Public Health Nutr 2019; 22(5): 936-941. ArticlePubMedPMC
- 2. Louzada ML, Baraldi LG, Steele EM, Martins AP, Canella DS, Moubarac JC, et al. Consumption of ultra-processed foods and obesity in Brazilian adolescents and adults. Prev Med 2015; 81: 9-15. ArticlePubMedPMC
- 3. Rauber F, Campagnolo PD, Hoffman DJ, Vitolo MR. Consumption of ultra-processed food products and its effects on children's lipid profiles: a longitudinal study. Nutr Metab Cardiovasc Dis 2015; 25(1): 116-122. ArticlePubMed
- 4. Lavigne-Robichaud M, Moubarac JC, Lantagne-Lopez S, Johnson-Down L, Batal M, Laouan Sidi EA, et al. Diet quality indices in relation to metabolic syndrome in an Indigenous Cree (Eeyouch) population in northern Québec, Canada. Public Health Nutr 2018; 21(1): 172-180. ArticlePubMedPMC
- 5. Park H, Lee Y, Hwang J, Lee Y. Ultra-processed food consumption and increased risk of metabolic syndrome in Korean adults: a cross-sectional analysis of the KNHANES 2016-2020. Nutrition 2024; 122: 112374.ArticlePubMed
- 6. Srour B, Fezeu LK, Kesse-Guyot E, Allès B, Méjean C, Andrianasolo RM, et al. [Consumption of ultra-processed foods and risk of cardiovascular disease in the NutriNet-Santé cohort]. Nutr Clin Métab 2019; 33(1): 29. French.
- 7. Moubarac JC, Batal M, Louzada ML, Martinez Steele E, Monteiro CA. Consumption of ultra-processed foods predicts diet quality in Canada. Appetite 2017; 108: 512-520. ArticlePubMedPMC
- 8. Louzada MLDC, Ricardo CZ, Steele EM, Levy RB, Cannon G, Monteiro CA. The share of ultra-processed foods determines the overall nutritional quality of diets in Brazil. Public Health Nutr 2018; 21(1): 94-102. ArticlePubMedPMC
- 9. Moubarac JC, Parra DC, Cannon G, Monteiro CA. Food classification systems based on food processing: significance and implications for policies and actions: a systematic literature review and assessment. Curr Obes Rep 2014; 3(2): 256-272. ArticlePubMedPMCPDF
- 10. Jung S, Kim JY, Park S. Eating patterns in Korean adults, 1998-2018: increased energy contribution of ultra-processed foods in main meals and snacks. Eur J Nutr 2024; 63(1): 279-289. ArticlePubMedPMCPDF
- 11. Shim JS, Shim SY, Cha HJ, Kim J, Kim HC. Socioeconomic characteristics and trends in the consumption of ultra-processed foods in Korea from 2010 to 2018. Nutrients 2021; 13(4): 1120.ArticlePubMedPMC
- 12. Lee H, Yim Y, Cho Y, Oh J, Kim S, Son Y, et al. Long-term trends and patterns in ultra-processed food consumption among Korean adults from 1998 to 2022. Sci Rep 2025; 15(1): 4131.ArticlePubMedPMCPDF
- 13. Poobalan AS, Aucott LS, Clarke A, Smith WC. Diet behaviour among young people in transition to adulthood (18-25 year olds): a mixed method study. Health Psychol Behav Med 2014; 2(1): 909-928. ArticlePubMedPMC
- 14. Costa CDS, Faria FR, Gabe KT, Sattamini IF, Khandpur N, Leite FHM, et al. Nova score for the consumption of ultra-processed foods: description and performance evaluation in Brazil. Rev Saude Publica 2021; 55: 13.ArticlePubMedPMC
- 15. Kébé SD, Diouf A, Sylla PMDD, Kane K, Dos Santos Costa C, Leite FHM, et al. Assessment of ultra processed foods consumption in Senegal: validation of the Nova-UPF screener. Arch Public Health 2024; 82(1): 4.ArticlePubMedPMC
- 16. Correa-Madrid MC, Correa Guzmán N, Bergeron G, Restrepo-Mesa SL, Cediel G. Validation of the NOVA score for the consumption of ultra-processed foods by young women of Medellín, Colombia. Ann N Y Acad Sci 2023; 1528(1): 69-76. ArticlePubMed
- 17. Ghosh-Jerath S, Mediratta S, Kumar G, Kohli S, Marrocos-Leite FH, Khandpur N, et al. Validation of a screener to assess ultra-processed food consumption in the adult Indian population: the Nova-UPF Screener (for India). Br J Nutr 2025; 134(9): 743-754. ArticlePubMedPMC
- 18. Park HJ, Park S, Kim JY. Development of Korean NOVA food classification and estimation of ultra-processed food intake among adults: using 2018 Korea National Health and Nutrition Examination Survey. Korean J Community Nutr 2022; 27(6): 455-467. ArticleLink
- 19. Jung S, Park S, Kim JY. Comparison of dietary share of ultra-processed foods assessed with a FFQ against a 24-h dietary recall in adults: results from KNHANES 2016. Public Health Nutr 2022; 25(5): 1166-1175. ArticlePubMedPMC
- 20. Cho YJ, Park S, Kim SS, Park HJ, Son JW, Lee TK, et al. The Gangwon obesity and metabolic syndrome study: methods and initial baseline data. J Obes Metab Syndr 2022; 31(4): 303-312. ArticlePubMedPMC
- 21. Yun SH, Shim J, Kweon S, Oh K. Development of a food frequency questionnaire for the Korea National Health and Nutrition Examination Survey: data from the Fourth Korea National Health and Nutrition Examination Survey (KNHANES IV). Korean J Nutr 2013; 46(2): 186-196. Article
- 22. Baranowski T. 24-Hour recall and diet record methods. In: Willett W, editor. Nutritional epidemiology. 3rd ed. Oxford Academic; 2013. p. 49-69. Article
- 23. Monteiro CA, Cannon G, Lawrence M, da Costa Louzada ML, Machado PP. Ultra-processed foods, diet quality, and health using the NOVA classification system. Food and Agriculture Organization of the United Nations; 2019; 3-12. Link
- 24. Willett WC. Reproducibility and validity of food-frequency questionnaires. In: Willett W, editor. Nutritional epidemiology. 3rd ed. Oxford University Press; 2013. p. 80-87.
- 25. Bull FC, Al-Ansari SS, Biddle S, Borodulin K, Buman MP, Cardon G, et al. World Health Organization 2020 guidelines on physical activity and sedentary behaviour. Br J Sports Med 2020; 54(24): 1451-1462. ArticlePubMedPMC
- 26. Kim Y, Yang Y, Park H, Kim J. Development of physical activity guidelines and self-prescription guides for Koreans. Korea Health Promotion Institute; 2012 Nov. Report No. TRKO201500007063. Link
- 27. Jung SJ, Shin DH. Gochujang, a Korean traditional fermented soybean product: history, preparation and functionality. J Ethn Food 2024; 11(1): 43.ArticlePDF
- 28. Sung H, Park JM, Oh SU, Ha K, Joung H. Consumption of ultra-processed foods increases the likelihood of having obesity in Korean women. Nutrients 2021; 13(2): 698.ArticlePubMedPMC
- 29. Song HJ, Park S, Kwon JW. Quality of life of middle-aged adults in single households in South Korea. Qual Life Res 2018; 27(8): 2117-2125. ArticlePubMedPDF
- 30. Gugliucci V, Machín L, Alcaire F, Otterbring T, de León C, Natero V, et al. The content of Instagram posts featuring ultra-processed products through the lens of the heuristic-systematic model. Appetite 2023; 181: 106393.ArticlePubMed
- 31. Gascoyne C, Scully M, Wakefield M, Morley B. Food and drink marketing on social media and dietary intake in Australian adolescents: findings from a cross-sectional survey. Appetite 2021; 166: 105431.ArticlePubMed
- 32. Kucharczuk AJ, Oliver TL, Dowdell EB. Social media’s influence on adolescents’ food choices: a mixed studies systematic literature review. Appetite 2022; 168: 105765.ArticlePubMed
REFERENCES
Figure & Data
REFERENCES
Citations
Citations to this article as recorded by 
 Cite
CiteDevelopment of a simplified NOVA-based scoring tool for assessing ultra-processed food consumption among Korean young adults: a cross-sectional study
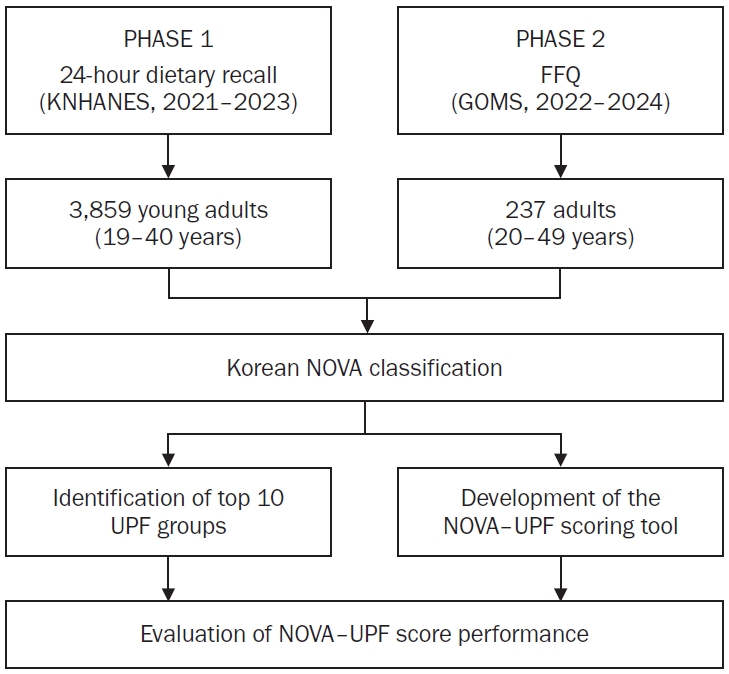

Fig. 1. Diagram of data analysis employed in the development and performance evaluation of the NOVA–UPF scoring tool. KNHANES, Korea National Health and Nutrition Examination Survey; FFQ, food frequency questionnaire; GOMS, Gangwon Obesity and Metabolic Syndrome; UPF, ultra-processed food.
Fig. 2. Cumulative contribution of UPF subgroups based on 24-hour dietary recall data among adults aged 19–40 years in the KNHANES (2021–2023) (n = 3,859). UPF, ultra-processed food; KNHANES, Korea National Health and Nutrition Examination Survey.
Fig. 1.
Fig. 2.
Development of a simplified NOVA-based scoring tool for assessing ultra-processed food consumption among Korean young adults: a cross-sectional study
| UPF subgroups (%kcal) | Total (n = 3,859) | Men (n = 1,726) | Women (n = 2,133) | P-value |
|---|---|---|---|---|
| Noodles and pasta dishes | 16.0 ± 0.5 | 17.1 ± 0.7 | 14.1 ± 0.6 | < 0.001 |
| Soda, beverages | 15.0 ± 0.4 | 15.7 ± 0.6 | 14.2 ± 0.5 | 0.060 |
| Breads and bakery products | 13.4 ± 0.4 | 11.3 ± 0.6 | 15.7 ± 0.6 | < 0.001 |
| Seasonings and condiments | 10.2 ± 0.3 | 10.3 ± 0.4 | 10.1 ± 0.4 | 0.705 |
| Traditional sauces | 9.0 ± 0.3 | 9.8 ± 0.5 | 8.1 ± 0.4 | 0.013 |
| Processed meat and packaged meat products | 8.6 ± 0.3 | 10.1 ± 0.5 | 7.1 ± 0.4 | < 0.001 |
| Snack foods | 6.3 ± 0.3 | 4.7 ± 0.4 | 8.0 ± 0.4 | < 0.001 |
| Convenience or ready-to-eat foods | 4.9 ± 0.3 | 5.5 ± 0.4 | 4.2 ± 0.3 | 0.011 |
| Dairy products | 4.2 ± 0.2 | 3.0 ± 0.3 | 5.4 ± 0.3 | < 0.001 |
| Cocoa and chocolate products | 3.5 ± 0.2 | 3.4 ± 0.4 | 3.6 ± 0.3 | 0.581 |
| Processed fish and seafood products | 2.8 ± 0.2 | 2.7 ± 0.2 | 2.8 ± 0.2 | 0.772 |
| Frozen desserts or ice cream | 2.5 ± 0.2 | 2.0 ± 0.2 | 3.1 ± 0.3 | 0.001 |
| Processed agricultural products | 2.6 ± 0.2 | 2.8 ± 0.3 | 2.4 ± 0.2 | 0.285 |
| Dietary supplements | 0.8 ± 0.1 | 1.0 ± 0.2 | 0.5 ± 0.1 | 0.059 |
| Jams and spreads | 0.2 ± 0.0 | 0.2 ± 0.0 | 0.3 ± 0.0 | 0.131 |
| Processed rice cakes | 0.2 ± 0.0 | 0.2 ± 0.1 | 0.2 ± 0.1 | 0.783 |
| Edible oils and fats | 0.2 ± 0.1 | 0.1 ± 0.0 | 0.1 ± 0.0 | 0.980 |
| Pickled or preserved foods | 0.1 ± 0.0 | 0.1 ± 0.0 | 0.0 ± 0.0 | 0.459 |
| Food additives | 0.0 ± 0.0 | 0.0 ± 0.0 | 0.0 ± 0.0 | 0.361 |
| Sugars and sweeteners | 0.0 ± 0.0 | 0.0 ± 0.0 | 0.0 ± 0.0 | 0.318 |
| Food group | NOVA–UPF score | ||||||
|---|---|---|---|---|---|---|---|
| Rarely or never | 1–3 times/month | 1 time/week | 2–4 times/week | 5–6 times/week | ≥ 1 time/day | NOVA–UPF score range | |
| Noodles and pasta dishes | 0 | 1 | 2 | 3 | 4 | 5 | 0–5 |
| Soda, beverages | 0 | 1 | 2 | 3 | 4 | 5 | 0–5 |
| Breads and bakery products | 0 | 1 | 2 | 3 | 4 | 5 | 0–5 |
| Seasonings and condiments | 0 | 1 | 2 | 3 | 4 | 5 | 0–5 |
| Traditional sauces | 0 | 1 | 2 | 3 | 4 | 5 | 0–5 |
| Processed meat and packaged meat products | 0 | 1 | 2 | 3 | 4 | 5 | 0–5 |
| Snack foods | 0 | 1 | 2 | 3 | 4 | 5 | 0–5 |
| Convenience or ready-to-eat foods | 0 | 1 | 2 | 3 | 4 | 5 | 0–5 |
| Dairy products | 0 | 1 | 2 | 3 | 4 | 5 | 0–5 |
| Cocoa and chocolate products | 0 | 1 | 2 | 3 | 4 | 5 | 0–5 |
| Total possible score | Total possible NOVA–UPF score: 0–50 | ||||||
| Variables | Total (n = 237) | Men (n = 65) | Women (n = 172) | P-value |
|---|---|---|---|---|
| Total | 237 (100.0) | 65 (27.4) | 172 (72.6) | |
| Marital status | 0.925 | |||
| Spouse, including common-law partner | 196 (82.7) | 54 (83.1) | 142 (82.6) | |
| Without a spouse |
41 (17.3) | 11 (16.9) | 30 (17.4) | |
| Education level | 0.011 | |||
| ≤ Middle school | 5 (2.1) | 0 (0.0) | 5 (2.9) | |
| High school | 73 (30.8) | 12 (18.5) | 61 (35.5) | |
| ≥ College | 159 (67.1) | 53 (81.5) | 106 (61.6) | |
| Household income per month (million KRW) | 0.913 | |||
| < 2 | 17 (7.2) | 4 (6.2) | 13 (7.6) | |
| 2–4 | 77 (32.5) | 22 (33.9) | 55 (32.0) | |
| > 4 | 143 (60.3) | 39 (60.0) | 104 (60.5) | |
| Household type (n = 236) | 0.976 | |||
| Single member | 22 (9.3) | 6 (9.2) | 16 (9.4) | |
| Non-single | 214 (90.7) | 59 (90.8) | 155 (90.6) | |
| Smoking status (n = 234) | < 0.001 | |||
| Never smoker |
171 (73.1) | 29 (45.3) | 142 (83.5) | |
| Former smoker | 25 (10.7) | 12 (18.8) | 13 (7.7) | |
| Current smoker | 38 (16.2) | 23 (35.9) | 15 (8.8) | |
| Drinking status | 0.287 | |||
| Current drinking | 182 (76.8) | 53 (81.5) | 129 (75.0) | |
| Current abstainer |
55 (23.2) | 12 (18.5) | 43 (25.0) | |
| Recommended PA levels |
0.160 | |||
| No PA Level | 104 (43.9) | 23 (35.4) | 81 (47.1) | |
| Insufficient or inactive PA levels | 49 (20.7) | 18 (27.7) | 31 (18.0) | |
| Recommended PA level | 84 (35.4) | 24 (36.9) | 60 (34.9) |
| Variables | NOVA–UPF score | P-value |
|---|---|---|
| Age (year) | 0.610 | |
| 20–29 | 21.3 ± 7.1 | |
| 30–39 | 23.6 ± 8.7 | |
| 40–49 | 22.8 ± 8.3 | |
| Gender | 0.500 | |
| Men | 23.5 ± 8.6 | |
| Women | 22.6 ± 8.2 | |
| Marital status | 0.907 | |
| Spouse, including common-law partner | 22.9 ± 8.2 | |
| Without a spouse |
22.7 ± 8.7 | |
| Education level | 0.259 | |
| ≤ Middle school | 24.8 ± 8.7 | |
| High school | 21.6 ± 8.2 | |
| ≥ College | 23.4 ± 8.3 | |
| Household income per month (million KRW) | 0.373 | |
| < 2 | 22.1 ± 10.0 | |
| 2–4 | 21.9 ± 7.8 | |
| > 4 | 23.5 ± 8.3 | |
| Household type | 0.388 | |
| Single member | 21.5 ± 10.0 | |
| Non-single | 23.1 ± 8.1 | |
| Smoking status | 0.343 | |
| Never smoker |
22.8 ± 8.3 | |
| Former smoker | 25.0 ± 9.4 | |
| Current smoker | 22.0 ± 7.6 | |
| Drinking status | 0.959 | |
| Current drinking | 22.9 ± 8.2 | |
| Current abstainer |
22.8 ± 8.7 | |
| Recommended PA levels |
0.584 | |
| No PA Level | 22.7 ± 8.7 | |
| Insufficient or inactive PA levels | 24.0 ± 7.4 | |
| Recommended PA level | 22.5 ± 8.3 |
| UPF consumption (%kcal) | NOVA–UPF score | Total | ||
|---|---|---|---|---|
| T1 (lowest) | T2 (middle) | T3 (highest) | ||
| T1 (lowest) | 53 (67.1) | 20 (25.3) | 6 (7.6) | 79 (100) |
| T2 (middle) | 23 (29.1) | 32 (40.5) | 24 (30.4) | 79 (100) |
| T3 (highest) | 6 (7.6) | 27 (34.2) | 46 (58.2) | 79 (100) |
| Total | 82 (34.6) | 79 (33.3) | 76 (32.1) | 237 (100) |
Table 1. Comparison of energy intake (%) from UPF subgroups according to gender among adults aged 19–40 years in the KNHANES (2021–2023) (n = 3,859)
Adjusted mean ± SE from multivariate regression models. All values, except for the total energy intake, are expressed as %kcal/day. All estimates were calculated using sampling weights to account for the complex survey design of KNHANES. UPF, ultra-processed food; KNHANES, Korea National Health and Nutrition Examination Survey.
Table 2. Scoring criteria for NOVA–UPF items according to consumption frequency
UPF, ultra-processed food.
Table 3. General characteristics of study participants according to gender based on FFQ data among adults aged 20–49 years in the GOMS cohort study (2022–2024) (n = 237)
n (%). Sample sizes vary depending on the variables. FFQ, food frequency questionnaire; GOMS, Gangwon Obesity and Metabolic Syndrome; PA, physical activity. Without a spouse: individuals who are separated, divorced, widowed, or never married. Never smokers: those who have smoked < 100 cigarettes over their lifetime. Current abstainer: no lifetime experience of alcohol consumption or no alcohol intake during the past year. Recommended PA level: engaging in at least 150 minutes per week of moderate-intensity physical activity or 75 minutes per week of vigorous-intensity physical activity.
Table 4. Mean NOVA–UPF scores according to general characteristics of participants in the GOMS cohort study (2022–2024) (n = 237)
Mean ± SD. UPF, ultra-processed food; GOMS, Gangwon Obesity and Metabolic Syndrome; PA, physical activity. Without a spouse: individuals who are separated, divorced, widowed, or never married. Never smokers: those who have smoked < 100 cigarettes over their lifetime. Current abstainer: no lifetime experience of alcohol consumption or no alcohol intake during the past year. Recommended PA level: engaging in at least 150 minutes per week of moderate-intensity physical activity or 75 minutes per week of vigorous-intensity physical activity.
Table 5. Cross-classification of participants by tertiles of UPF energy intake (%) and NOVA–UPF scores based on FFQ data in the GOMS cohort study (2022–2024) (n = 237)
n (%). The weighted kappa coefficient for agreement across tertiles was 0.279. Spearman’s correlation coefficient = 0.629, UPF, ultra-processed food; FFQ, food frequency questionnaire; GOMS, Gangwon Obesity and Metabolic Syndrome.


