
Articles
- Page Path
- HOME > Korean J Community Nutr > Volume 31(1); 2026 > Article
-
Research Article
- Impact of a foodservice establishment manager’s willingness to perform duties on hygiene management levels and the mediating effects of extrinsic motivations: a cross-sectional study
-
Tae Yang Kim1)
 , Mi Young Lee2), Young Eun Lee3),†
 -
Korean Journal of Community Nutrition 2026;31(1):36-49.
DOI: https://doi.org/10.5720/kjcn.2025.00332
Published online: February 28, 2026
1)Teacher, Pyeonggok Elementary School, Eumseong, Korea
2)Education Advisor, CheongNamDae Presidential Retreat, Cheongju, Korea
3)Professor, Department of Food and Nutrition, College of Human Ecology, Chungbuk National University, Cheongju, Korea
- †Corresponding author Young Eun Lee Department of Food and Nutrition, College of Human Ecology, Chungbuk National University, 1 Chungdae-ro, Seowon-gu, Cheongju 28644, Korea Tel: +82-43-261-2742 Fax: +82-43-267-2742 Email: ylee@chungbuk.ac.kr
• Received: November 5, 2025 • Revised: December 11, 2025 • Accepted: January 21, 2026
© 2026 The Korean Society of Community Nutrition
This is an Open-Access article distributed under the terms of the Creative Commons Attribution Non-Commercial License (https://creativecommons.org/licenses/by-nc/4.0) which permits unrestricted non-commercial use, distribution, and reproduction in any medium, provided the original work is properly cited.
- 1,178 Views
- 91 Download
Abstract
-
Objectives
- Consumer demand is growing for more rigorous hygiene management within foodservice establishments. The aim of this study was to provide customized data specific to each foodservice establishment, thereby informing policy formulation to improve hygiene management levels.
-
Methods
- We surveyed 310 managers of directly managed foodservice establishments (excluding franchises) that were subject to hygiene inspections by the Chungbuk Provincial Office in Korea between September 1 and 27, 2023. Additionally, 30 investigators trained in methods for evaluating the hygiene management levels of foodservice establishments objectively assessed 310 establishments using evaluation sheets. All 310 managers provided consent and personally completed the questionnaires. questionnaires. Data from 277 managers were included in the analysis. General characteristics were analyzed with descriptive statistics in IBM SPSS Statistics 28 (IBM Corp.). Univariate normality verification, measurement model verification, structural model verification, and mediation effect significance analysis were conducted using R’s lavaan package (version 4.3.2.).
-
Results
- Managers’ willingness to perform duties had a positive influence on hygiene management level (0.224), enthusiasm for hygiene (0.661), awareness of hygiene compliance (0.616), mandatory perception of the system (0.568), trust in local governments (0.406), and attention to consumers (0.558). In the relationship between managers’ willingness to perform duties and hygiene management level, mandatory perception of the system had a negative mediating effect (–0.223), while trust in local governments had a positive mediating effect (0.264).
-
Conclusion
- Structural equation modeling was used to identify the complex pathways by which foodservice establishment managers’ willingness to perform duties, mediated by their human factors, influences their hygiene management level. Accordingly, policy implications were presented, suggesting that the hygiene management level of foodservice establishments could be enhanced by increasing managers’ willingness to perform their duties, and that a shift from mandatory regulations by local governments to support-oriented systems that foster trust in local governments is necessary.
INTRODUCTION
METHODS
RESULTS
Limitations
Conclusion
-
CONFLICT OF INTEREST
There are no financial or other issues that might lead to conflicts of interest.
-
FUNDING
None.
-
DATA AVAILABILITY
Research data is available upon request to the corresponding author.
NOTES
Fig. 1.Mediating model of enthusiasm for hygiene, awareness of hygiene compliance, mandatory perception of the system, trust in local governments, attention to consumers in a relation to willingness to perform duties and hygiene management levels. **P < 0.01, ***P < 0.001.

Table 1.Factor analysis on the willingness to perform duties and extrinsic motivation variables
Table 2.General characteristics of the respondents (n = 277)
Table 3.Dependence of foodservice establishment manager’s human factor scores hygiene management levels
| Observed variables | Group 1 (n = 123)1) | Group 2 (n = 154)2) | P-value |
|---|---|---|---|
| Willingness to perform duties 1 | 3.32 ± 0.70 | 3.83 ± 0.76 | < 0.001 |
| Willingness to perform duties 2 | 3.50 ± 0.82 | 3.95 ± 0.77 | < 0.001 |
| Willingness to perform duties 3 | 3.66 ± 0.81 | 3.99 ± 0.78 | < 0.001 |
| Enthusiasm for hygiene 1 | 3.64 ± 0.69 | 3.96 ± 0.70 | < 0.001 |
| Enthusiasm for hygiene 2 | 3.71 ± 0.79 | 3.97 ± 0.75 | 0.004 |
| Enthusiasm for hygiene 3 | 3.72 ± 0.69 | 3.99 ± 0.79 | 0.004 |
| Awareness of hygiene compliance 1 | 3.28 ± 0.79 | 3.50 ± 0.93 | 0.035 |
| Awareness of hygiene compliance 2 | 3.41 ± 0.77 | 3.61 ± 0.85 | 0.053 |
| Awareness of hygiene compliance 3 | 3.23 ± 0.83 | 3.61 ± 0.94 | < 0.001 |
| Mandatory perception of the system 1 | 3.27 ± 0.71 | 3.64 ± 0.82 | < 0.001 |
| Mandatory perception of the system 2 | 3.40 ± 0.72 | 3.75 ± 0.81 | < 0.001 |
| Mandatory perception of the system 3 | 3.33 ± 0.83 | 3.73 ± 0.83 | < 0.001 |
| Trust in local governments 1 | 3.65 ± 0.67 | 3.89 ± 0.81 | 0.007 |
| Trust in local governments 2 | 3.74 ± 0.65 | 3.94 ± 0.81 | 0.020 |
| Trust in local governments 3 | 3.74 ± 0.70 | 3.91 ± 0.86 | 0.078 |
| Attention to consumers 1 | 3.26 ± 0.84 | 3.73 ± 0.82 | < 0.001 |
| Attention to consumers 2 | 3.50 ± 0.64 | 3.90 ± 0.70 | < 0.001 |
| Attention to consumers 3 | 3.56 ± 0.66 | 3.89 ± 0.73 | < 0.001 |
Table 4.Measurement model verification on the willingness to perform duties and extrinsic motivation variables
| Latent variables | Observed variables | B | SE | β | AVE | CR |
|---|---|---|---|---|---|---|
| Willingness to perform duties | Willingness to perform duties 1 | 1.000 | 0.829 | 0.750 | 0.899 | |
| Willingness to perform duties 2 | 0.923*** | 0.048 | 0.934 | |||
| Willingness to perform duties 3 | 0.861*** | 0.050 | 0.850 | |||
| Enthusiasm for hygiene | Enthusiasm for hygiene 1 | 1.000 | 0.822 | 0.669 | 0.867 | |
| Enthusiasm for hygiene 2 | 1.150*** | 0.068 | 0.886 | |||
| Enthusiasm for hygiene 3 | 0.938*** | 0.070 | 0.737 | |||
| Awareness of hygiene compliance | Awareness of hygiene compliance 1 | 1.000 | 0.951 | 0.792 | 0.918 | |
| Awareness of hygiene compliance 2 | 0.973*** | 0.045 | 0.849 | |||
| Awareness of hygiene compliance 3 | 0.982*** | 0.042 | 0.875 | |||
| Mandatory perception of the system | Mandatory perception of the system 1 | 1.000 | 0.917 | 0.794 | 0.923 | |
| Mandatory perception of the system 2 | 0.953*** | 0.038 | 0.933 | |||
| Mandatory perception of the system 3 | 0.940*** | 0.048 | 0.830 | |||
| Trust in local governments | Trust in local governments 1 | 1.000 | 0.878 | 0.752 | 0.900 | |
| Trust in local governments 2 | 1.005*** | 0.052 | 0.888 | |||
| Trust in local governments 3 | 1.029*** | 0.058 | 0.841 | |||
| Attention to consumers | Attention to consumers 1 | 1.000 | 0.866 | 0.777 | 0.915 | |
| Attention to consumers 2 | 1.078*** | 0.049 | 0.951 | |||
| Attention to consumers 3 | 1.002*** | 0.056 | 0.830 | |||
| Conformance criteria analysis result | χ2/df = 309.166/120, P < 0.001, CFI = 0.956, TLI = 0.944, RMSEA = 0.075 | |||||
Table 5.Results of discriminant validity on the extrinsic motivation variables
| Latent variables | Latent variable correlations | ||||
|---|---|---|---|---|---|
| Enthusiasm for hygiene | Awareness of hygiene compliance | Mandatory perception of the system | Trust in local governments | Attention to consumers | |
| Enthusiasm for hygiene | 0.8181) | ||||
| Awareness of hygiene compliance | 0.668 | 0.89 | |||
| Mandatory perception of the system | 0.369 | 0.401 | 0.891 | ||
| Trust in local governments | 0.424 | 0.444 | 0.451 | 0.867 | |
| Attention to consumers | 0.436 | 0.395 | 0.404 | 0.455 | 0.881 |
Table 6.Structural coefficient and significance of structural model on the willingness to perform duties, extrinsic motivation variables, and hygiene management levels
| Path | B | SE | β | t |
|---|---|---|---|---|
| Willingness to perform duties → Hygiene management levels | 1.834 | 0.653 | 0.244 | 2.808** |
| Willingness to perform duties → Enthusiasm for hygiene | 0.591 | 0.058 | 0.661 | 10.145*** |
| Willingness to perform duties → Awareness of hygiene compliance | 0.586 | 0.056 | 0.616 | 10.453*** |
| Willingness to perform duties → Mandatory perception of the system | 0.642 | 0.069 | 0.568 | 9.324*** |
| Willingness to perform duties → Trust in local governments | 0.397 | 0.063 | 0.406 | 6.307*** |
| Willingness to perform duties → Attention to consumers | 0.516 | 0.058 | 0.558 | 8.910*** |
| Enthusiasm for hygiene → Hygiene management levels | 1.674 | 1.087 | 0.199 | 1.540 |
| Awareness of hygiene compliance → Hygiene management levels | 0.332 | 0.901 | 0.042 | 0.369 |
| Mandatory perception of the system → Hygiene management levels | –1.485 | 0.569 | –0.223 | –2.607** |
| Trust in local governments → Hygiene management levels | 2.031 | 0.632 | 0.264 | 3.212** |
| Attention to consumers → Hygiene management levels | –0.743 | 0.702 | –0.091 | –1.058 |
| Conformance criteria analysis result | χ2/df = 314.025/132, P < 0.001, CFI = 0.958, TLI = 0.945, RMSEA = 0.071 | |||
Table 7.Significance of the mediating effect of structural model on willingness to perform duties, extrinsic motivation variables, and hygiene management levels
- 1. Korean Statistical Information Service. Trends in eating out more than once a day [Internet]. Ministry of Data and Statistics; 2025 [cited 2026 Jan 21]. Available from: https://kosis.kr/statHtml/statHtml.do?orgId=177&tblId=DT_11702_N043&conn_path=I2
- 2. Korean Statistical Information Service. Number of food poisoning cases and patient status by city and facility [Internet]. Ministry of Data and Statistics; 2025 [cited 2026 Jan 21]. Available from: https://kosis.kr/statHtml/statHtml.do?orgId=145&tblId=DT_145012_A010&conn_path=I2
- 3. Heo SJ, Bae HJ. A survey on customers’ perception of a hygiene grade certification system for restaurants. J Nutr Health 2020; 53(2): 203-214. ArticleLink
- 4. Korean Law Information Center. Food sanitation act [Internet]. Ministry of Food and Drug Safety; 1962 [cited 2024 Aug 19] Available from: https://www.law.go.kr/LSW/lsInfoP.do?lsiSeq=8297&ancYd=19620120&ancNo=01007&efYd=19620421&nwJoYnInfo=N&efGubun=Y&chrClsCd=010202&ancYnChk=0#0000
- 5. Korean Law Information Center. Food sanitation act [Internet]. Ministry of Food and Drug Safety; 1986 [cited 2024 Aug 19] Available from: https://www.law.go.kr/LSW/lsInfoP.do?lsiSeq=59175&ancYd=19860510&ancNo=03823&efYd=19861111&nwJoYnInfo=N&efGubun=Y&chrClsCd=010202&ancYnChk=0#0000
- 6. Korean Law Information Center. Food sanitation act [Internet]. Ministry of Food and Drug Safety; 2015 [cited 2024 Aug 19] Available from: https://www.law.go.kr/LSW/lsInfoP.do?lsiSeq=169531&ancYd=20150327&ancNo=13277&efYd=20150327&nwJoYnInfo=N&efGubun=Y&chrClsCd=010202&ancYnChk=0#0000
- 7. Lee JW, Baek DH. Disclosure of restaurant hygiene information and food poisoning: focused to restaurant hygiene grading in Seoul. Korean Soc Public Adm 2019; 30(1): 255-276. Article
- 8. Chung MJ, Choi JH, Ryu K, Kwak TK. Development of self-managed food sanitation check-list and on-site monitoring of food sanitation management practices in restaurants for control of foodborne illness risk factors. Korean J Food Cook Sci 2010; 26(5): 603-616. Link
- 9. Kim GS, Ahn KY, Jung MY. The effects of internal marketing on job satisfaction in food service industry. Asia Pac J Bus Ventur Entrep 2012; 7(3): 27-37. Article
- 10. White RW. Motivation reconsidered: the concept of competence. Psychol Rev 1959; 66(5): 297-333. ArticlePubMed
- 11. Campbell RF, Corbally JE, Nystrand RO. Introduction to education administration. 6th ed. Allyn and Bacan; 1983. Link
- 12. Ryan RM, Deci EL. Self-determination theory and the facilitation of intrinsic motivation, social development, and well-being. Am Psychol 2000; 55(1): 68-78. ArticlePubMed
- 13. Park JK, Cho MH. Multiple comparison analyses on employee work engagement and organizational performance according to sustainability leadership for restaurant managers. Culin Sci Hosp Res 2024; 30(8): 54-67. Article
- 14. Song JW. The influence of management characteristics and management environment of small restaurant operators on the perceived management performance. FoodService Ind J 2020; 16(1): 157-174. ArticleLink
- 15. Ha JC, Lee JW, Chung HS. Effects of transformational leadership on job engagement : analyzing the mediating effect of market oriented culture and the moderating effect of CEO-trust. Korean J Hum Resour Dev 2019; 22(4): 231-258. Article
- 16. Shin SI. The relationship of intrinsic and extrinsic major selection motivation to career decision level among college students: the mediating role of emotional and personality career difficulties. J Learn Cent Curric Instr 2021; 21(14): 447-460. Article
- 17. Park NH, Shin HK. The impact of ESG management activities of hamburger restaurant companies on corporate image and customer loyalty. J Distrib Manag Res 2024; 27(3): 109-122. ArticleLink
- 18. Carroll AB. A three-dimensional conceptual model of corporate performance. Acad Manag Rev 1979; 4(4): 497-505. Article
- 19. Chang HJ, Kwak TK, Ju SY, Shin JY, Kim SH, Heo EJ, et al. Analysis of current food code for the improvement of hygiene management practices in restaurants by comparing standards and guidelines of developed countries. J Foodservice Manag 2016; 19(3): 7-23. Link
- 20. Christensen T, Lægreid P. Trust in government: the relative importance of service satisfaction, political factors, and demography. Public Perform Manag Rev 2005; 28(4): 487-511.
- 21. Omari R, Ruivenkamp GTP, Tetteh EK. Consumers’ trust in government institutions and their perception and concern about safety and healthiness of fast food. J Trust Res 2017; 7(2): 170-186. Article
- 22. Kim SH, Lee JH. E-participation, transparency, and trust in local government. Public Admin Rev 2012; 72: 819-828. ArticleLink
- 23. Lim HS, Yoon HH. An influence of corporate social responsibility on brand image, brand trust, brand commitment and behavior. J Foodservice Manag 2021; 24(1): 55-83. Article
- 24. Sichtmann C. Buyer-seller relationships and the economics of information. J Bus Market Manage 2007; 1: 59-78. ArticlePDF
- 25. Chon ML, Yoo JM. Corporate social responsibility and financial performance - investigating the moderating effects of motive and commitment of CSR -. Korean Manag Rev 2013; 42(5): 1159-1185. Link
- 26. An HJ, Lee SI. A study on the effect of corporate social responsibility of food service companies on corporate reputation and customer loyalty. J Foodservice Manag 2024; 27(5): 165-183. Article
- 27. Jin GZ, Leslie P. Reputational incentives for restaurant hygiene. Am Econ J Microecon 2009; 1(1): 237-267. Article
- 28. Jin GZ, Leslie P. The effect of information on product quality: evidence from restaurant hygiene grade cards. Q J Econ 2003; 118(2): 409-451. Article
- 29. Wang KM, Hong WS. Importance-performance analysis on kitchen hygiene management of small-scale foodservice company employees. J Korean Soc Food Sci Nutr 2019; 48(11): 1291-1302. Article
- 30. Kim HK, Kang KS. Study on the food service Industry company hygiene techniques by applying AHP. J Tour Leis Res 2015; 27(6): 341-358. Link
- 31. Sembiring H, Perangin-angin Br S, Silitonga LM. The relationship between knowledge and attitudes of food handlers with the implementation of food hygiene sanitation at restaurants in Minas District in 2022. Contagion Sci Period J Public Health Coastal Health 2023; 5(2): 408-419. ArticleLink
- 32. Kim J. An analysis of the changes in the cause-and-effect relationships between socio-economic indicators and the road network of Seoul using structural equation model. J Korean Geogr Soc 2009; 44(6): 797-812.
- 33. Kline RB. Principles and practice of structural equation modeling 3rd ed. Guilford Publications; 2010; Link
- 34. Yang WS, Seo JM, Shin DJ. The structural relationship between sense of calling and consequences of food hygiene : focused on food hygiene attitude, food hygiene engagement, food quality performance. J Hosp Tour Stud 2022; 24(3): 5-17. Article
- 35. Kim SJ, Han JS, Lee HM. A study on the influence of job engagement and customer orientation according to hotel employees’ sense of calling and psychological ownership. Int J Tour Hosp Res 2023; 37(2): 147-162. Article
- 36. Lee JY, Lee SM. The development and validation of Korean Academic Engagement Inventory (KAEI). Korean J Educ Methodol Stud 2012; 24(1): 131-147. ArticleLink
- 37. Little TD, Cunningham WA, Shahar G, Widaman KF. To parcel or not to parcel: exploring the question, weighing the merits. Struct Equ Modeling A Multidiscip J 2002; 9(2): 151-173. Article
- 38. Jeon HK. The effects of maternal psychological control on the adult attachment of students in university: the mediating effect of the need for approval. Stud Korean Youth 2015; 26(3): 165-193. Article
- 39. Matsunaga M. Item parceling in structural equation modeling: a primer. Commun Method Meas 2008; 2(4): 260-293. Article
- 40. Tavakol M, Wetzel A. Factor analysis: a means for theory and instrument development in support of construct validity. Int J Med Educ 2020; 11: 245-247. ArticlePubMedPMC
- 41. Bollen KA. Structural equations with latent variables. John Wiley & Sons; 1989. ArticleLink
- 42. Kline RB. Principles and practice of structural equation modeling. 2nd ed. Guilford Publications; 2005. Link
- 43. Anderson JC, Gerbing DW. Structural equation modeling in practice: a review and recommended two-step approach. Psychol Bull 1988; 103(3): 411-423. Article
- 44. Hong SH. The criteria for selecting appropriate fit indices in structural equation modeling and their rationales. Korean J Clin Psychol 2000; 19(1): 161-177. Link
- 45. Kim YT, Lee SJ. Utilization of R Program for the partial least square model: comparison of SmartPLS and R. J Digit Converg 2015; 13(12): 117-124. Article
- 46. Heo DW, Sung WJ. A study on e-government’s quality, intention to use, and satisfaction on public value: focused on “Government 24” internal system. J Korean Assoc Reg Inf Soc 2020; 23(1): 25-50. ArticleLink
- 47. Yu CJ, Jeong YS. The effect of Korean wave image on consumption value: focusing on overseas restaurant franchises. Korea Trade Rev 2024; 49(5): 129-148. Article
- 48. Carmines EG, Zeller RA. Reliability and validity assessment SAGE Publications; 1979; Link
- 49. Fornell C, Larcker DF. Evaluating structural equation models with unobservable variables and measurement error. J Market Res 1981; 18(1): 39-50. ArticleLink
- 50. Kim YJ, Lee HR. A study on the effects of small food business owner’s characteristics and success factors on business performance. J Foodservice Manag 2016; 19(1): 431-455. Link
- 51. Han HS, Kim MS, Kim SH. The effect of intrinsic job motivation on organizational commitment and innovative behavior by employees in foodservice industry. Korean J Hosp Tour 2015; 24(2): 175-198. Link
- 52. Lyu SW, Kim SY. Effect of policy tool choice on SME innovation: focusing on manufacturing firms. Korean Policy Sci Rev 2010; 14(2): 65-90. Link
- 53. Song NG. The effects of satisfaction and trust with quality according to the ways of local government civil administration service. J Korean Policy Stud 2012; 12(4): 247-270.
- 54. Jung HI, Lee SR. Effects of government-sponsored management consulting on business performance: focusing on the mediating effect of goverment-supported consulting program satisfaction and the moderating effect of consulting support type. Korean Manag Consult Rev 2023; 23(2): 61-72. Link
- 55. Park JH, Seo YW. An effect of consulting service quality and consultant capacity on business performance: focused on innovative willingness and consulting satisfaction of small and medium enterprises. Korean Manag Consult Rev 2020; 20(4): 69-80. Link
- 56. Lee SM. The concept and practice of administrative guidance. Admin Law J 2014; 38: 49-81. Link
- 57. Choi YN. An exploratory study on the impact of public service values on organizational performance from the public's perspective- focusing on the moderating effects of fairness and transparency in public administrative services. Korean J Local Gov Admin Stud 2023; 37(4): 125-157. ArticleLink
- 58. Lee SB. Analysis of administrative service satisfaction according to level of government-citizen contact: focusing on the difference between e-government and analogue government. Korean Soc Public Admin 2018; 29(1): 211-231. Link
- 59. Im YG, Kim KW. Outcome expectations, self-efficacy, eating environment, and eating behaviors by the stages of change in adequate sodium intake among university students: a cross-sectional study. Korean J Community Nutr 2024; 29(5): 382-395. ArticlePubMedPMCPDF
REFERENCES
Figure & Data
REFERENCES
Citations
Citations to this article as recorded by 
 Cite
CiteImpact of a foodservice establishment manager’s willingness to perform duties on hygiene management levels and the mediating effects of extrinsic motivations: a cross-sectional study
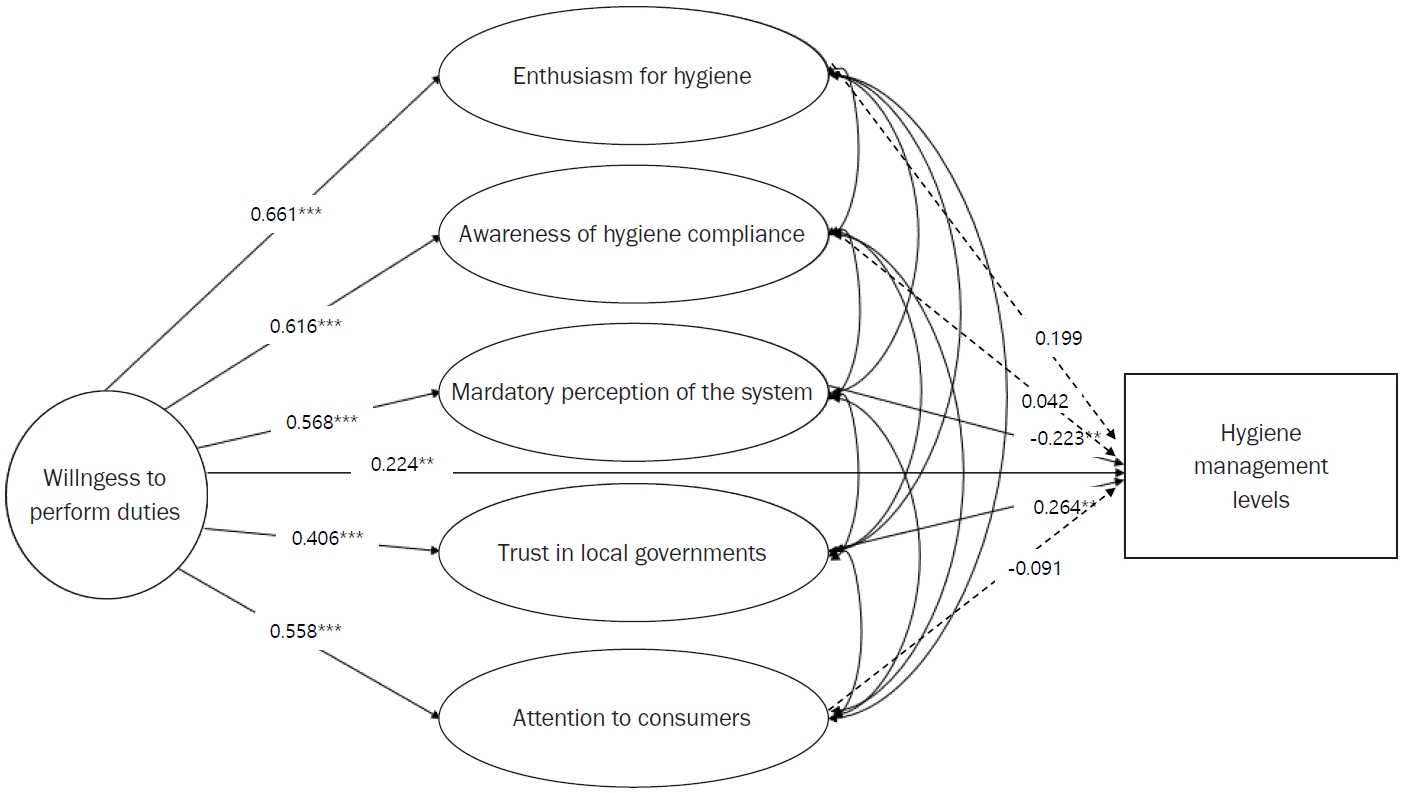
Fig. 1. Mediating model of enthusiasm for hygiene, awareness of hygiene compliance, mandatory perception of the system, trust in local governments, attention to consumers in a relation to willingness to perform duties and hygiene management levels. **P < 0.01, ***P < 0.001.
Fig. 1.
Impact of a foodservice establishment manager’s willingness to perform duties on hygiene management levels and the mediating effects of extrinsic motivations: a cross-sectional study
| Item (item parceling) | Factor loading | Cronbach’s alpha |
|---|---|---|
| Willingness to perform duties | 0.914 | |
| Willingness to perform duties 1 | ||
| Foodservice establishments operation and management tasks energize me | 0.86 | |
| I believe foodservice establishments operation and management tasks are challenging | 0.65 | |
| Willingness to perform duties 2 | ||
| When performing foodservice establishments operation and management tasks, I feel mentally strong | 0.84 | |
| I am confident in foodservice establishments operation and management tasks | 0.70 | |
| When performing foodservice establishments operation and management tasks, I have the ability to solve problems | 0.77 | |
| Willingness to perform duties 3 | ||
| When performing foodservice establishments operation and management tasks, I pour all my energy into it | 0.80 | |
| When performing foodservice establishments operation and management tasks, time passes quickly for me | 0.72 | |
| When performing foodservice establishments operation and management tasks, I forget everything except the work | 0.74 | |
| Enthusiasm for hygiene | 0.816 | |
| Enthusiasm for hygiene 1 | ||
| I well understand the purpose and necessity of hygiene management | 0.86 | |
| I am participating in or intend to participate in the hygiene grade certification system | 0.38 | |
| Enthusiasm for hygiene 2 | ||
| I strive to adhere to hygiene-related guidelines | 0.85 | |
| I know the purpose and qualifications of the hygiene grade certification system | 0.63 | |
| Enthusiasm for hygiene 3 | ||
| I am confident in hygiene management | 0.73 | |
| Awareness of hygiene compliance | 0.920 | |
| Awareness of hygiene compliance 1 | ||
| I strive to comply with recommended, not just mandatory, hygiene-related rules | 0.90 | |
| I well understand the purpose and guidelines of food hygiene-related laws | 0.79 | |
| Awareness of hygiene compliance 2 | ||
| I comply with the relevant laws not only during inspection periods but also on a regular basis | 0.88 | |
| Awareness of hygiene compliance 3 | ||
| I comply with hygiene-related laws | 0.87 | |
| Mandatory perception of the system | 0.914 | |
| Mandatory perception of the system 1 | ||
| I adhere better to hygiene-related guidelines due to the reward and punishment system (certification system or administrative disposition) | 0.86 | |
| I adhere better to hygiene-related guidelines due to consumer evaluations via SNS | 0.74 | |
| Mandatory perception of the system 2 | ||
| I adhere better to hygiene-related guidelines due to complaint reports to local governments | 0.84 | |
| I adhere better to hygiene-related guidelines due to local governments’ hygiene inspection system. | 0.74 | |
| Mandatory perception of the system 3 | ||
| I adhere better to hygiene-related guidelines due to the introduction of the hygiene grade certification system | 0.83 | |
| I adhere better to hygiene-related guidelines due to hygiene education by the local government | 0.77 | |
| Trust in local governments | 0.917 | |
| Trust in local governments 1 | ||
| I believe local governments’ hygiene-related policies are useful | 0.90 | |
| When hygiene issues arise between consumers and establishments, local governments provide neutral and objective resolutions | 0.77 | |
| Trust in local governments 2 | ||
| Local governments propose appropriate solutions for hygiene-related problems | 0.85 | |
| I believe hygiene-related support provided by local governments helps with foodservice establishments hygiene management | 0.79 | |
| Trust in local governments 3 | ||
| Local governments provide the necessary information (changes in hygiene-related laws, guidelines, etc.). | 0.84 | |
| Attention to consumers | 0.910 | |
| Attention to consumers 1 | ||
| I believe consumers will provide positive and active feedback if food is hygienic | 0.87 | |
| I believe consumers will feel assured about foodservice establishments hygiene due to participation of the foodservice establishments in the hygiene grade certification system | 0.72 | |
| Attention to consumers 2 | ||
| I believe consumer satisfaction will improve if food is hygienic | 0.86 | |
| I believe loyal consumers will increase and sales will improve if food is hygienic | 0.82 | |
| Attention to consumers 3 | ||
| I believe consumers will revisit through immediate and satisfactory resolution of hygiene-related complaints | 0.83 |
| Characteristics | Value |
|---|---|
| Sex | |
| Male | 102 (36.80) |
| Female | 175 (63.20) |
| Age (year) | |
| 20–29 | 8 (2.90) |
| 30–39 | 31 (11.20) |
| 40–49 | 70 (25.20) |
| 50–59 | 90 (32.50) |
| ≥ 60 | 78 (28.20) |
| No. of employees | 2.25 ± 1.34 |
| No. of customers (daily) | 41.02 ± 30.52 |
| Total revenue per seat (KRW/day) | |
| < 20 | 465,794 ± 270,726 |
| 20–49 | 566,496 ± 451,758 |
| ≥ 50 | 916,170 ± 614,794 |
| Total revenue per seat (KRW/day) | 586,928 ± 453,530 |
| Observed variables | Group 1 (n = 123) |
Group 2 (n = 154) |
P-value |
|---|---|---|---|
| Willingness to perform duties 1 | 3.32 ± 0.70 | 3.83 ± 0.76 | < 0.001 |
| Willingness to perform duties 2 | 3.50 ± 0.82 | 3.95 ± 0.77 | < 0.001 |
| Willingness to perform duties 3 | 3.66 ± 0.81 | 3.99 ± 0.78 | < 0.001 |
| Enthusiasm for hygiene 1 | 3.64 ± 0.69 | 3.96 ± 0.70 | < 0.001 |
| Enthusiasm for hygiene 2 | 3.71 ± 0.79 | 3.97 ± 0.75 | 0.004 |
| Enthusiasm for hygiene 3 | 3.72 ± 0.69 | 3.99 ± 0.79 | 0.004 |
| Awareness of hygiene compliance 1 | 3.28 ± 0.79 | 3.50 ± 0.93 | 0.035 |
| Awareness of hygiene compliance 2 | 3.41 ± 0.77 | 3.61 ± 0.85 | 0.053 |
| Awareness of hygiene compliance 3 | 3.23 ± 0.83 | 3.61 ± 0.94 | < 0.001 |
| Mandatory perception of the system 1 | 3.27 ± 0.71 | 3.64 ± 0.82 | < 0.001 |
| Mandatory perception of the system 2 | 3.40 ± 0.72 | 3.75 ± 0.81 | < 0.001 |
| Mandatory perception of the system 3 | 3.33 ± 0.83 | 3.73 ± 0.83 | < 0.001 |
| Trust in local governments 1 | 3.65 ± 0.67 | 3.89 ± 0.81 | 0.007 |
| Trust in local governments 2 | 3.74 ± 0.65 | 3.94 ± 0.81 | 0.020 |
| Trust in local governments 3 | 3.74 ± 0.70 | 3.91 ± 0.86 | 0.078 |
| Attention to consumers 1 | 3.26 ± 0.84 | 3.73 ± 0.82 | < 0.001 |
| Attention to consumers 2 | 3.50 ± 0.64 | 3.90 ± 0.70 | < 0.001 |
| Attention to consumers 3 | 3.56 ± 0.66 | 3.89 ± 0.73 | < 0.001 |
| Latent variables | Observed variables | B | SE | β | AVE | CR |
|---|---|---|---|---|---|---|
| Willingness to perform duties | Willingness to perform duties 1 | 1.000 | 0.829 | 0.750 | 0.899 | |
| Willingness to perform duties 2 | 0.923 |
0.048 | 0.934 | |||
| Willingness to perform duties 3 | 0.861 |
0.050 | 0.850 | |||
| Enthusiasm for hygiene | Enthusiasm for hygiene 1 | 1.000 | 0.822 | 0.669 | 0.867 | |
| Enthusiasm for hygiene 2 | 1.150 |
0.068 | 0.886 | |||
| Enthusiasm for hygiene 3 | 0.938 |
0.070 | 0.737 | |||
| Awareness of hygiene compliance | Awareness of hygiene compliance 1 | 1.000 | 0.951 | 0.792 | 0.918 | |
| Awareness of hygiene compliance 2 | 0.973 |
0.045 | 0.849 | |||
| Awareness of hygiene compliance 3 | 0.982 |
0.042 | 0.875 | |||
| Mandatory perception of the system | Mandatory perception of the system 1 | 1.000 | 0.917 | 0.794 | 0.923 | |
| Mandatory perception of the system 2 | 0.953 |
0.038 | 0.933 | |||
| Mandatory perception of the system 3 | 0.940 |
0.048 | 0.830 | |||
| Trust in local governments | Trust in local governments 1 | 1.000 | 0.878 | 0.752 | 0.900 | |
| Trust in local governments 2 | 1.005 |
0.052 | 0.888 | |||
| Trust in local governments 3 | 1.029 |
0.058 | 0.841 | |||
| Attention to consumers | Attention to consumers 1 | 1.000 | 0.866 | 0.777 | 0.915 | |
| Attention to consumers 2 | 1.078 |
0.049 | 0.951 | |||
| Attention to consumers 3 | 1.002 |
0.056 | 0.830 | |||
| Conformance criteria analysis result | χ2/df = 309.166/120, P < 0.001, CFI = 0.956, TLI = 0.944, RMSEA = 0.075 | |||||
| Latent variables | Latent variable correlations | ||||
|---|---|---|---|---|---|
| Enthusiasm for hygiene | Awareness of hygiene compliance | Mandatory perception of the system | Trust in local governments | Attention to consumers | |
| Enthusiasm for hygiene | 0.818 |
||||
| Awareness of hygiene compliance | 0.668 | 0.89 | |||
| Mandatory perception of the system | 0.369 | 0.401 | 0.891 | ||
| Trust in local governments | 0.424 | 0.444 | 0.451 | 0.867 | |
| Attention to consumers | 0.436 | 0.395 | 0.404 | 0.455 | 0.881 |
| Path | B | SE | β | t |
|---|---|---|---|---|
| Willingness to perform duties → Hygiene management levels | 1.834 | 0.653 | 0.244 | 2.808 |
| Willingness to perform duties → Enthusiasm for hygiene | 0.591 | 0.058 | 0.661 | 10.145 |
| Willingness to perform duties → Awareness of hygiene compliance | 0.586 | 0.056 | 0.616 | 10.453 |
| Willingness to perform duties → Mandatory perception of the system | 0.642 | 0.069 | 0.568 | 9.324 |
| Willingness to perform duties → Trust in local governments | 0.397 | 0.063 | 0.406 | 6.307 |
| Willingness to perform duties → Attention to consumers | 0.516 | 0.058 | 0.558 | 8.910 |
| Enthusiasm for hygiene → Hygiene management levels | 1.674 | 1.087 | 0.199 | 1.540 |
| Awareness of hygiene compliance → Hygiene management levels | 0.332 | 0.901 | 0.042 | 0.369 |
| Mandatory perception of the system → Hygiene management levels | –1.485 | 0.569 | –0.223 | –2.607 |
| Trust in local governments → Hygiene management levels | 2.031 | 0.632 | 0.264 | 3.212 |
| Attention to consumers → Hygiene management levels | –0.743 | 0.702 | –0.091 | –1.058 |
| Conformance criteria analysis result | χ2/df = 314.025/132, P < 0.001, CFI = 0.958, TLI = 0.945, RMSEA = 0.071 | |||
| Path | B | SE | 95% Confidence interval (bias-corrected bootstrap) | |
|---|---|---|---|---|
| Lower | Upper | |||
| Willingness to perform duties → Mandatory perception of the system → Hygiene management levels | –0.953 | 0.386 | –1.696 | –0.148 |
| Willingness to perform duties → Trust in local governments → Hygiene management levels | 0.807 | 0.269 | 0.372 | 1.435 |
Table 1. Factor analysis on the willingness to perform duties and extrinsic motivation variables
Table 2. General characteristics of the respondents (n = 277)
n (%) or Mean ± SD.
Table 3. Dependence of foodservice establishment manager’s human factor scores hygiene management levels
Mean ± SD. The 5-point Likert scale (1 = not at all, 2 = not really, 3 = average, 4 = somewhat, 5 = very much so). Group 1, group with lower than average score of the hygiene management levels. Group 2, group with upper than average score of the hygiene management levels.
Table 4. Measurement model verification on the willingness to perform duties and extrinsic motivation variables
B, unstandardized coefficient; SE, standard error; β, standardized coefficient; AVE, average variance extracted; CR, composite reliability; df, degrees of freedom; CFI, comparative fit index; TLI, Tucker-Lewis index; RMSEA, root mean square error of approximation.
Table 5. Results of discriminant validity on the extrinsic motivation variables
The square root of the average variance extracted for each latent variable was confirmed to verify whether the latent variables were distinct from each other.
Table 6. Structural coefficient and significance of structural model on the willingness to perform duties, extrinsic motivation variables, and hygiene management levels
B, unstandardized coefficient; SE, standard error; β, standardized coefficient; t, t-statistic; df, degrees of freedom; CFI, comparative fit index; TLI, Tucker-Lewis index; RMSEA, root mean square error of approximation.
Table 7. Significance of the mediating effect of structural model on willingness to perform duties, extrinsic motivation variables, and hygiene management levels
B, unstandardized coefficient; SE, standard error.


