
Articles
- Page Path
- HOME > Korean J Community Nutr > Volume 28(6); 2023 > Article
-
Research Article
커뮤니티케어 대상 노인의 NQ-E 지수 기반 개별영양상담 효과성: 복합만성질환과 삶의 질 개선에 관한 중재 연구 -
최윤정1)
 , 이지현2), 임희숙3), 박유경4),†
 - Effectiveness of NQ-E index-based individual nutrition counseling for community-care elderly: an intervention study on improving nutritional status, complex chronic diseases, and quality of life
-
Yoonjeong Choi1), Jihyun Lee2), Heesook Lim3), Yoo Kyoung Park4),†
-
Korean Journal of Community Nutrition 2023;28(6):480-494.
DOI: https://doi.org/10.5720/kjcn.2023.28.6.480
Published online: December 31, 2023
1)경희대학교 동서의학대학원 의학영양학과 고령서비스-테크 융합전공, 대학원생
2)용인시 수지노인복지관, 영양사
3)경희대학교 동서의학대학원 노인학과 고령서비스-테크 융합전공, 조교수
4)경희대학교 동서의학대학원 의학영양학과, 교수
1)Graduate Student, Dept. of Medical Nutrition (AgeTech-Service Convergence Major), Graduate School of East-West Medical Science, Kyung Hee University, Yongin, Korea
2)Dietitian, Suji Senior Welfare Center, Yongin, Korea
3)Assistant Professor, Dept. of Gerontology (AgeTech-Service Convergence Major), Graduate School of East-West Medical Science, Kyung Hee University, Yongin, Korea
4)Professor, Dept. of Medical Nutrition, Graduate School of East-West Medical Science, Kyung Hee University, Yongin, Korea
- †Corresponding author Yoo Kyoung Park Department of Medical Nutrition, Graduate School of East-West Medical Science, Kyung Hee University, Yongin 17104, Korea. Tel: +82-31-201-3816 Fax: +82-31-2013-3816 E-mail: ypark@khu.ac.kr
• Received: November 9, 2023 • Revised: December 11, 2023 • Accepted: December 29, 2023
© 2023 The Korean Society of Community Nutrition
This is an Open-Access article distributed under the terms of the Creative Commons Attribution Non-Commercial License (http://creativecommons.org/licenses/by-nc/4.0) which permits unrestricted non-commercial use, distribution, and reproduction in any medium, provided the original work is properly cited.
- 2,281 Views
- 79 Download
- 4 Crossref
Abstract
-
Objectives
- This study sought to assess the effectiveness of community-based nutrition counseling on improving nutritional status, managing complex chronic diseases, and enhancing the quality of life for elderly individuals with chronic conditions, particularly in older adults with high levels of food insecurity and multiple chronic illnesses.
-
Methods
- Thirty elderly subjects with diabetes and hypertension who were registered at local Senior Welfare Center received individualized nutrition counseling, based on their Nutrition Quotient for the Elderly (NQ-E) index. Over a 16-week period, they received tailored counseling and underwent various health and nutritional assessments. The final analysis included 28 participants after two dropped out. Data analysis was conducted using the SPSS v28.0.
-
Results
- The subjects were over 70, with multiple chronic diseases including diabetes and hypertension and predominantly female. After 16 weeks, significant improvements were observed in the subjects’ grip strength, and HbA1c levels, as well as in their NQ-E scores, indicating improved dietary balance and diversity. There were no significant improvements in the ‘Moderation’ subdomain of the NQ-E index, suggesting that this aspect requires further attention in nutritional counseling. The subjects' nutritional risk scores (NSI) were also significantly decreased, indicating less nutritional risk. Lastly, as measured by the SF-36K, the subjects’ quality of life showed significant improvement in several domains including physical role performance and social function.
-
Conclusions
- This study demonstrates that tailored nutrition counseling, based on the NQ-E index, can improve elderly health, manage chronic diseases, and enhance quality of life. This approach potentially broadens the scope of community nutritionists' roles within an aging society. However, additional research is necessary to evaluate these interventions' long-term effects and sustainability.
Introduction
Methods
1)연구설계
2)연구 상담 방법 및 효과 평가
3)일반사항
4) 체성분 및 신체계측 조사
5)혈당측정 및 생화학검사
6) 노인영양지수
7) NSI (nutrition screening initiative) 체크리스트
8) SF-36K (Short form 36-item health survey, Korean version)
9) 영양상담
Results
Discussion
Conclusion
-
Conflict of Interest
There are no financial or other issues that might lead to conflict of interest.
-
Funding
This research was supported by a grant from the Korea Institute of Planning and Evaluation for Technology in Food, Agriculture and Forestry (IPET) through High Value-added Food Technology Development Program funded by the Ministry of Agriculture, Food and Rural Affairs (MAFRA)(grant number 322010-5) and from BK21 plus program, Ministry of Education of Korea, (Grant Number: 5120200313836).
-
Acknowledgments
We extend our gratitude to Director Kim Jeon-ho of Suji Senior Welfare Center during the study.
-
Data Availability
The participants of this study did not give written consent for their data to be shared publicly, so due to the sensitive nature of the research supporting data is not available.
NOTES
Fig. 1.Diagram of study flow. High (75%-100% NQ-E percentile), Medium-High (50%-<75%), Medium-Low (25%-<50%), Low (0%-<25%)
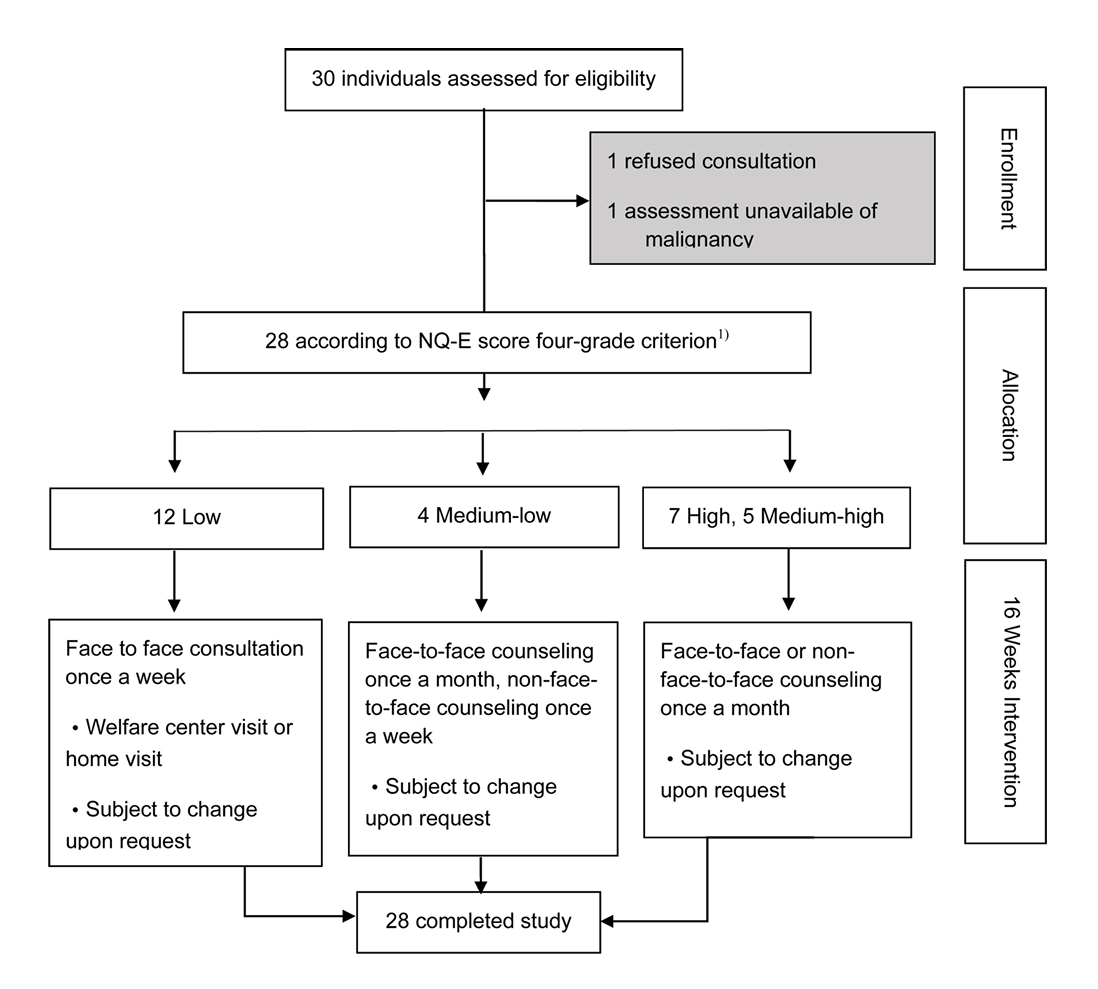
Fig. 2.Changes of NQ-E score range by the grade criterion from baseline to study end in the participants (n = 28). The grade criterion is following: High (75%-100% NQ-E percentile), Medium-High (50%-<75%), Medium-Low (25%-<50%), and Low (0%-<25%). NQ-E, Nutrition Quotient for Elderly

Table 1.A comprehensive nutrition intervention program for study subjects
Table 2.General characteristics of study subjects (n = 28)
| Characteristics | n | % | |
|---|---|---|---|
| Gender | |||
| Male | 6 | 21.4 | |
| Female | 22 | 78.6 | |
| Age of respondents (year) | |||
| 60-69 | 4 | 14.3 | |
| 70-79 | 15 | 53.6 | |
| 80-89 | 9 | 32.1 | |
| Average age | 76.54 ± 5.28 | ||
| Weight (kg) | 62.70 ± 11.16 | ||
| Height (cm) | 158.61 ± 8.38 | ||
| BMI (kg/m2) | |||
| Underweight | 10 | 35.7 | |
| Normal1) | 5 | 17.9 | |
| Over weight | 9 | 32.1 | |
| Obesity | 4 | 14.2 | |
| Educational level(year) | |||
| 0-6 | 7 | 25.0 | |
| 7-12 | 19 | 67.9 | |
| > 12 | 2 | 7.1 | |
| Family members | |||
| Alone | 18 | 64.3 | |
| More than two people | 10 | 35.7 | |
| Community care target | 28 | 100.0 |
Table 3.Chronic disease history by subject (n = 28)
Table 4.Changes of anthropometry and laboratory measurements from baseline to study end in the participants
Table 5.Changes of the level and scores of NQ-E from baseline to study end in the participants
|
Subjects (n = 28) |
||||
|---|---|---|---|---|
| Before | After | P-value | ||
| NQ-E1), n (%) | Low | 12 (42.9) | 0 (0.0) | |
| Medium | 9 (32.1) | 4 (14.3) | ||
| High | 7 (25.0) | 24 (85.7) | ||
| NQ-E score | 59.39 ± 9.66 | 70.49 ± 6.53 | < 0.001 | |
| Balance, n (%) | Low | 9 (32.1) | 0 (0.0) | |
| Medium | 10 (35.7) | 8 (28.6) | ||
| High | 9 (32.1) | 20 (71.4) | ||
| Balance score | 44.44 ± 22.70 | 65.80 ± 16.42 | < 0.001 | |
| Diversity, n (%) | Low | 16 (57.1) | 2 (7.1) | |
| Medium | 10 (35.7) | 16 (57.1) | ||
| High | 2 (7.1) | 10 (35.7) | ||
| Diversity score | 40.49 ± 14.56 | 55.77 ± 13.81 | < 0.001 | |
| Moderation, n (%) | Low | 9 (32.1) | 5 (17.9) | |
| Medium | 9 (32.1) | 12 (42.9) | ||
| High | 10 (35.7) | 11 (39.3) | ||
| Moderation score | 76.60 ± 17.73 | 80.83 ± 15.94 | 0.202 | |
| Behavior, n (%) | Low | 12 (42.9) | 0 (0.0) | |
| Medium | 12 (42.9) | 7 (25.0) | ||
| High | 4 (14.3) | 21 (75.0) | ||
| Behavior score | 51.43 ± 11.92 | 73.06 ± 9.96 | < 0.001 | |
Table 6.Changes in NSI1) checklist results (nutritional risk assessment) before and after the study of research subjects
Table 7.Changes in nutritional score of subjects using the NSI checklist before and after the study
|
Subjects (n = 28) |
|
||
|---|---|---|---|
| Before | After | ||
| NSI Score1), n (%) | Low risk | 0 (0.0) | 0 (0.0) |
| Moderate risk | 0 (0.0) | 25 (89.3) | |
| High risk | 28 (100.0) | 3 (10.7) | |
Table 8.Changes in quality of Life (measured using SF-36K1) health survey) of subjects before and after the study
|
Subjects (n = 28) |
|||
|---|---|---|---|
| Before | After | P-value | |
| SF total score2) | 59.17 ± 11.83 | 86.38 ± 15.00 | < 0.001 |
| Physical Functioning (PF) | 41.93 ± 5.37 | 43.70 ± 3.62 | 0.094 |
| Role-Physical (RP) | 44.00 ± 5.05 | 49.50 ± 1.01 | < 0.001 |
| Bodily Pain (BP) | 49.50 ± 4.38 | 49.35 ± 2.75 | 0.881 |
| General Health (GH) | 55.21 ± 5.56 | 47.40 ± 3.45 | < 0.001 |
| Vitality (VT) | 50.32 ± 4.42 | 51.93 ± 2.05 | 0.085 |
| Social Functioning (SF) | 45.64 ± 2.98 | 49.58 ± 1.78 | < 0.001 |
| Role-Emotional (RE) | 47.61 ± 3.73 | 50.57 ± 1.57 | 0.001 |
| Mental Health (MH) | 54.11 ± 7.35 | 52.28 ± 2.15 | 0.195 |
- 1. Statistics Korea. Population projections for Korea [Internet]. Statistics Korea; 2022 [cited 2022 Oct 13]. Available from: https://kosis.kr/eng/statisticsList/statisticsListIndex.do?menuId=M_01_01&vwcd=MT_ETITLE&parmTabId=M_01_01#content-group
- 2. Kim BR, Hwang HH. Analysis of major factors affecting the quality of life of the elderly in Korea in preparation for a super-aged society. Int J Environ Res Public Health 2022; 19(15): 9618.ArticlePubMedPMC
- 3. Hwang SY. An exploratory study on community-based end-of-life care policy for older adults. J Soc Sci 2022; 33(4): 259-282.Article
- 4. Shon C, Seo D, Hwang J. Factors influencing the community care satisfaction of the urban elderly focusing on the outreach community health service in Seoul. J Korean Public Health Nurs 2021; 35(2): 254-267.
- 5. Park JW, Yeo CK. A study on the economic impact and countermeasures of the population cliff caused by low birth rate and aging population: Focusing on major overseas cases. J Business Innov 2021; 44(4): 261-280.
- 6. Korea Institute for Health and Social Affairs. The hidden poor: Elderly poverty in Korea. Sejong: Korea Institute for Health and Social Affairs; 2020.
- 7. Hampl JS, Anderson JV, Mullis R. Position of the American Dietetic Association: The role of dietetics professionals in health promotion and disease prevention. J Am Diet Assoc 2002; 102(11): 1680-1687.PubMed
- 8. Lee MJ, Kim JH, Park OJ, Lee YM. A study on the needs for nutrition management program for elderly who use welfare facilities. Korean J Community Nutr 2016; 21(1): 65-74.ArticleLink
- 9. Ministry of Health and Welfare. 2020 Senior health statistics. Seoul (Korea): Ministry of Health and Welfare; 2020.
- 10. Nguyen H, Manolova G, Daskalopoulou C, Vitoratou S, Prince M, Prina AM. Prevalence of multimorbidity in community settings: A systematic review and meta-analysis of observational studies. J Comorb 2020; 10: 2235042X20916589.ArticlePubMedPMCLink
- 11. Diederichs C, Berger K, Bartels DB. The measurement of multiple chronic diseases-a systematic review on existing multimorbidity indices. J Gerontol A Biol Sci Med Sci 2011; 66(3): 301-311.ArticlePubMed
- 12. Salisbury C, Man MS, Bower P, Guthrie B, Chaplin K, Gaunt DM, et al. Management of multimorbidity using a patient-centred care model: A pragmatic cluster-randomised trial of the 3D approach. Lancet 2020; 392(10141): 41-50.Article
- 13. Yang H, Deng Q, Geng Q, Tang Y, Ma J, Ye W, et al. Association of self-rated health with chronic disease, mental health symptom and social relationship in older people. Sci Rep 2021; 11(1): 14653.ArticlePubMedPMCPDF
- 14. McPhail SM. Multimorbidity in chronic disease: Impact on health care resources and costs. Risk Manag Healthcare Policy 2016; 9: 143-156.ArticlePubMedPMC
- 15. Tamura Y, Omura T, Toyoshima K, Araki A. Nutrition management in older adults with diabetes: A review on the importance of shifting prevention strategies from metabolic syndrome to frailty. Nutrients 2020; 12(11): 3367.ArticlePubMedPMC
- 16. Kizil M, Turhan KN, Kizil R, Ustunkarli N. Relationship between chronic diseases and diet in older persons in nursing homes. Geriatric Care 2020; 6(4): 106-110.ArticleLink
- 17. Who J, Consultation FE. Diet, nutrition and the prevention of chronic diseases. World Health Organ Tech Rep Ser 2003; 916(i-viii): 1-149.
- 18. Tori NA, Shojaeizadeh D, Sum S, Hajian K. Effect of BASNEF-based nutrition education on nutritional behaviors among elderly people and Mini Nutritional Assessment on nutritional status in elderly with diabetes with type 2 diabetes (A clinical trial intervention). J Educ Health Promot 2019; 8(1): 94.PubMedPMC
- 19. Putri SE, Rekawati E, Wati DNK. Effectiveness of self-management on adherence to self-care and on health status among elderly people with hypertension. J Public Health Res 2021; 10(S1): 2406.ArticlePubMedPMCLink
- 20. Nguyen HT, Pavey TG, Collins PF, Nguyen NV, Pham TD, Gallegos D. Effectiveness of tailored dietary counseling in treating malnourished outpatients with chronic obstructive pulmonary disease: A randomized controlled trial. J Acad Nutr Diet 2020; 120(5): 778-791.ArticlePubMed
- 21. Shuremu M, Abate KH, Belachew T. Effect of nutrition education intervention to improve dietary diversity practice and nutritional status of the older people: A cluster randomized controlled trial. Food Sci Nutr 2023; 11(11): 7383-7395.ArticlePubMedPMC
- 22. Ahn JA, Park JW, Kim CJ. Effects of an individualised nutritional education and support programme on dietary habits, nutritional knowledge and nutritional status of older adults living alone. J Clin Nurs 2018; 27(9-10): 2142-2151.ArticlePubMedLink
- 23. Jyväkorpi S. Nutrition of older people and the effect of nutritional interventions on nutrient intake, diet quality and quality of life. 2016.
- 24. Lim YS, Lee JS, Hwang JY, Kim KN, Hwang HJ, Kwon S, et al. Revision of Nutrition Quotient for elderly in assessment of dietary quality and behavior. J Nutr Health 2022; 55(1): 155-173.ArticleLink
- 25. Ham SW, Kim KH. Evaluation of the dietary quality and nutritional status of elderly people using the Nutrition Quotient for Elderly (NQE) in Seoul. J Nutr Health 2020; 53(1): 68-82.ArticleLink
- 26. Gham M, Um M, Kye S. Evaluation of dietary quality and nutritional status based on nutrition quotient and health functional food intake in the Korea elderly. J Korean Soc Food Culture 2019; 34(4): 474-485.
- 27. Lee SE, Lee E. Effects of nutrition related factors on mortality risk among community-residing older adults in Korea. J Digit Converg 2018; 16(10): 343-350.
- 28. Celis-Morales CA, Welsh P, Lyall DM, Steell L, Petermann F, Anderson J, et al. Associations of grip strength with cardiovascular, respiratory, and cancer outcomes and all-cause mortality: Prospective cohort study of half a million UK Biobank participants. BMJ 2018; 361: k1651.ArticlePubMedPMC
- 29. Chung M, Kwak T, Kim H, Kang M, Lee J, Chung HR, et al. Development of NQ-E, nutrition quotient for Korean elderly: Item selection and validation of factor structure. J Nutr Health 2018; 51(1): 87-102.ArticleLink
- 30. Sugiura Y, Tanimoto Y, Imbe A, Inaba Y, Sakai S, Shishikura K, et al. Association between functional capacity decline and nutritional status based on the nutrition screening initiative checklist: A 2-year cohort study of Japanese community-dwelling elderly. PloS one 2016; 11(11): e0166037.ArticlePubMedPMC
- 31. Ware JE Jr, Sherbourne CD. The MOS 36-item short-form health survey (SF-36). I. Conceptual framework and item selection. Med Care 1992; 30(6): 473-483.PubMed
- 32. Korea Health Promotion Institute. 12-week nutritional program for patients with high blood pressure and diabetes [Internet]. Korea Health Promotion Institute; 2022 [cited 2022 Aug 8]. Available from: https://www.khepi.or.kr/kps/publish/view?menuId=MENU00890&page_no=B2017003&pageNum=10&siteId=&srch_text=&srch_cate=&srch_type=&str_clft_cd_list=&str_clft_cd_type_list=&board_idx=10820
- 33. Jung HW, Kim KI. Multimorbidity in older adults. J Korean Geriatr Soc 2014; 18(2): 65-71.Article
- 34. Huh Y, Lee JH, Jeon Y. Association between living alone and multimorbidity in the elderly. Korean J Health Promot 2020; 20(3): 102-107.Article
- 35. Shlisky J, Bloom DE, Beaudreault AR, Tucker KL, Keller HH, Freund-Levi Y, et al. Nutritional considerations for healthy aging and reduction in age-related chronic disease. Adv Nutr 2017; 8(1): 17-26.ArticlePubMedPMC
- 36. Baek OM. Factors associated with functional health outcomes in community-dwelling older adults: Applying Andersen's revised model. Korean J Community Welf 2011; 38: 1-27.
- 37. Lee IJ. A study on the factors affecting late-life disability. Health Soc Res 2010; 30(2): 55-84.Article
- 38. Lima MG, Barros MBDA, César CLG, Goldbaum M, Carandina L, Ciconelli RM. Health related quality of life among the elderly: A population-based study using SF-36 survey. Cad Saúde Pública 2009; 25(10): 2159-2167.ArticlePubMed
REFERENCES
Figure & Data
REFERENCES
Citations
Citations to this article as recorded by 
- A needs assessment for the development of a digital-based self-nutrition management education program for older adults in Korea: a cross-sectional study
Hae-Song Yoo, Jin-Myung Lee, Min-Sun Jeon
Korean Journal of Community Nutrition.2026; 31(2): 178. CrossRef - Health-related Quality of Life in Multimorbid Adults: A Random Forest Cross-sectional Analysis of the Korean National Health and Nutrition Examination Survey
Moonchang You, Geun-Myun Kim
Journal of Korean Academy of psychiatric and Mental Health Nursing.2025; 34(3): 349. CrossRef - A study on the development of nutrition counseling manual and curriculum for the disabled in Korea: a mixed-methods study
Kyoung-Min Lee, Woo-jeong Kim, So-young Kim, Young-mi Park, Hwa-young Yoon, Min-Sun Jeon
Korean Journal of Community Nutrition.2025; 30(5): 376. CrossRef - A Basic Study to Establish a Nutrition Education System for Welfare Facilities for the Elderly at Home Using Body Composition Analysis and Nutritional Management Cards
Sun Hee Lee, Seung-Lim Lee
The Korean Journal of Community Living Science.2024; 35(3): 471. CrossRef
 Cite
CiteEffectiveness of NQ-E index-based individual nutrition counseling for community-care elderly: an intervention study on improving nutritional status, complex chronic diseases, and quality of life

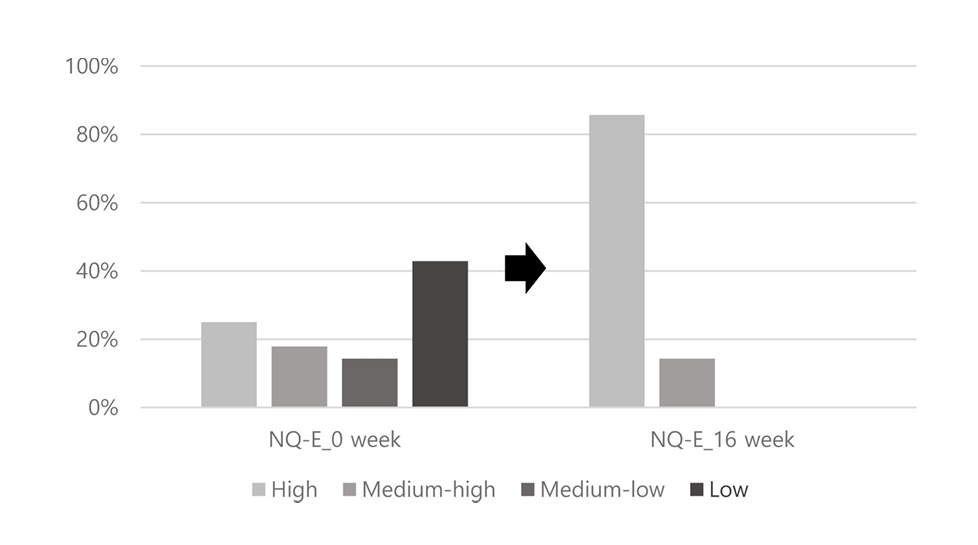
Fig. 1. Diagram of study flow. High (75%-100% NQ-E percentile), Medium-High (50%-<75%), Medium-Low (25%-<50%), Low (0%-<25%)
Fig. 2. Changes of NQ-E score range by the grade criterion from baseline to study end in the participants (n = 28). The grade criterion is following: High (75%-100% NQ-E percentile), Medium-High (50%-<75%), Medium-Low (25%-<50%), and Low (0%-<25%). NQ-E, Nutrition Quotient for Elderly
Fig. 1.
Fig. 2.
Effectiveness of NQ-E index-based individual nutrition counseling for community-care elderly: an intervention study on improving nutritional status, complex chronic diseases, and quality of life
| Group | Session | Contents | Method |
|---|---|---|---|
| 12 Low | session 1 | Understanding Hypertension and Diabetes: A Nutrition Research-Based Guide | 1:1, Pamphlet |
| session 2 | Nutritional Strategies for Managing Complications in Hypertension and Diabetes Patients | 1:1, Pamphlet | |
| session 3 | Nutritional Guidelines for Hypertension and Diabetes Patients: Strategies for Risk Reduction and Management | 1:1, Pamphlet | |
| session 4 | Dietary Recommendations for Hypertension and Diabetes Patients: A Nutrition Research-Based Guide | 1:1, Pamphlet | |
| session 5 | Smart Grocery Shopping for Hypertension and Diabetes Patients: A Nutrition Research-Informed Guide | 1:1, Pamphlet | |
| session 6 | Food Preparation Techniques for Hypertension and Diabetes: A Research-Based Guide | 1:1, Pamphlet | |
| session 7 | Nutrition Research-Based Dietary Guidelines for Hypertension and Diabetes Patients | 1:1, Pamphlet | |
| session 8 | Dietary Management Focus for Hypertension and Diabetes Patients | 1:1, Pamphlet | |
| session 9 | Nutrition Research-Informed Meal Management Strategies for Special Situations | 1:1, Pamphlet | |
| session 10 | Nutrition Research-Based Dietary Implementation Strategies for Hypertension and Diabetes Patients | 1:1, Pamphlet | |
| 4 Medium-low, 5 Medium-high | session 1 | Understanding Hypertension and Diabetes: A Nutrition Research-Based Guide | 1:1, Pamphlet |
| session 2 | Dietary Recommendations for Hypertension and Diabetes Patients: A Nutrition Research-Based Guide | 1:1, Pamphlet | |
| session 3 | Nutrition Research-Based Dietary Guidelines for Hypertension and Diabetes Patients | 1:1, Pamphlet | |
| session 4 | Nutrition Research-Based Dietary Implementation Strategies for Hypertension and Diabetes Patients | 1:1, Pamphlet | |
| 7 High | session 1 | Understanding Hypertension and Diabetes: A Nutrition Research-Based Guide | 1:1, Pamphlet |
| session 2 | Dietary Recommendations for Hypertension and Diabetes Patients: A Nutrition Research-Based Guide | 1:1, Pamphlet | |
| session 3 | Nutrition Research-Based Dietary Guidelines for Hypertension and Diabetes Patients | 1:1, Pamphlet | |
| session 4 | Nutrition Research-Based Dietary Implementation Strategies for Hypertension and Diabetes Patients | 1:1, Pamphlet |
| Characteristics | n | % | |
|---|---|---|---|
| Gender | |||
| Male | 6 | 21.4 | |
| Female | 22 | 78.6 | |
| Age of respondents (year) | |||
| 60-69 | 4 | 14.3 | |
| 70-79 | 15 | 53.6 | |
| 80-89 | 9 | 32.1 | |
| Average age | 76.54 ± 5.28 | ||
| Weight (kg) | 62.70 ± 11.16 | ||
| Height (cm) | 158.61 ± 8.38 | ||
| BMI (kg/m2) | |||
| Underweight | 10 | 35.7 | |
| Normal |
5 | 17.9 | |
| Over weight | 9 | 32.1 | |
| Obesity | 4 | 14.2 | |
| Educational level(year) | |||
| 0-6 | 7 | 25.0 | |
| 7-12 | 19 | 67.9 | |
| > 12 | 2 | 7.1 | |
| Family members | |||
| Alone | 18 | 64.3 | |
| More than two people | 10 | 35.7 | |
| Community care target | 28 | 100.0 |
| Variables | n | % |
|---|---|---|
| Hypertension | 26 | 92.9 |
| Diabetes | 28 | 100.0 |
| Dyslipidemia | 16 | 57.14 |
| Arthritis | 19 | 67.86 |
| Cancer | 3 | 10.71 |
| Coronary artery disease | 16 | 57.14 |
| Cerebrovascular disease | 3 | 10.71 |
| Depressive disorder | 6 | 21.43 |
| Variables | n | Before | After | P-value |
|---|---|---|---|---|
| Anthropometry | ||||
| BMI (kg/m2) | 28 | 25.06 ± 4.32 | 24.76 ± 4.07 | 0.011 |
| SBP (mmHg) | 27 | 137.37 ± 15.10 | 132.19 ± 13.79 | 0.154 |
| DBP (mmHg) | 27 | 70.41±10.28 | 70.15 ± 9.02 | 0.912 |
| Handgrip Strength (kg) | 26 | 19.07 ± 6.30 | 23.74 ± 5.33 | < 0.001 |
| Laboratory Measurements | ||||
| HbA1c (%) | 24 | 6.55 ± 0.87 | 6.40 ± 0.83 | 0.010 |
| Fasting Glc. (mg/dL) | 7 | 141.33 ± 16.92 | 128.33 ± 26.35 | 0.243 |
| Postprandial Glc. (mg/dL) | 20 | 174.18 ± 64.69 | 142.47 ± 40.25 | 0.056 |
| LDL (mg/dL) | 22 | 59.05 ± 24.42 | 64.95 ± 18.69 | 0.170 |
| HDL (mg/dL) | 23 | 58.87 ± 12.42 | 58.96 ± 13.46 | 0.968 |
| Total Chol. (mg/dL) | 23 | 150.70 ± 29.58 | 152.04 ± 27.37 | 0.760 |
| Triglycerides (mg/dL) | 23 | 185.26 ± 87.87 | 148.91 ± 57.29 | 0.106 |
| AI | 22 | 1.64 ± 0.70 | 1.64 ± 0.56 | 0.990 |
| Hemoglobin (g/dL) | 23 | 13.30 ± 2.11 | 12.98 ± 2.13 | 0.593 |
| Subjects (n = 28) |
||||
|---|---|---|---|---|
| Before | After | P-value | ||
| NQ-E |
Low | 12 (42.9) | 0 (0.0) | |
| Medium | 9 (32.1) | 4 (14.3) | ||
| High | 7 (25.0) | 24 (85.7) | ||
| NQ-E score | 59.39 ± 9.66 | 70.49 ± 6.53 | < 0.001 | |
| Balance, n (%) | Low | 9 (32.1) | 0 (0.0) | |
| Medium | 10 (35.7) | 8 (28.6) | ||
| High | 9 (32.1) | 20 (71.4) | ||
| Balance score | 44.44 ± 22.70 | 65.80 ± 16.42 | < 0.001 | |
| Diversity, n (%) | Low | 16 (57.1) | 2 (7.1) | |
| Medium | 10 (35.7) | 16 (57.1) | ||
| High | 2 (7.1) | 10 (35.7) | ||
| Diversity score | 40.49 ± 14.56 | 55.77 ± 13.81 | < 0.001 | |
| Moderation, n (%) | Low | 9 (32.1) | 5 (17.9) | |
| Medium | 9 (32.1) | 12 (42.9) | ||
| High | 10 (35.7) | 11 (39.3) | ||
| Moderation score | 76.60 ± 17.73 | 80.83 ± 15.94 | 0.202 | |
| Behavior, n (%) | Low | 12 (42.9) | 0 (0.0) | |
| Medium | 12 (42.9) | 7 (25.0) | ||
| High | 4 (14.3) | 21 (75.0) | ||
| Behavior score | 51.43 ± 11.92 | 73.06 ± 9.96 | < 0.001 | |
| Subjects (n = 28) |
|||
|---|---|---|---|
| Before | After | P-value | |
| NSI score | 10.86 ± 2.09 | 3.89 ± 0.96 | < 0.001 |
| One meal a day, n (%) | |||
| Yes | 2 (7.1) | 0 (0.0) | |
| No | 26 (92.9) | 28 (100.0) | |
| Excessive alcohol consumption, n (%) | |||
| Yes | 1 (3.6) | 0 (0.0) | |
| No | 27 (96.4) | 28 (100.0) | |
| Eating alone, n (%) | |||
| Yes | 20 (71.4) | 17 (60.7) | |
| No | 8 (28.6) | 11 (39.3) | |
| Multiple medication use, n (%) | |||
| Yes | 28 (100.0) | 24 (85.7) | |
| No | 0 (0.0) | 4 (14.3) | |
| Unintended weight change, n (%) | |||
| Yes | 13 (46.4) | 1 (3.6) | |
| No | 15 (53.6) | 27 (96.4) | |
| Subjects (n = 28) |
|||
|---|---|---|---|
| Before | After | ||
| NSI Score |
Low risk | 0 (0.0) | 0 (0.0) |
| Moderate risk | 0 (0.0) | 25 (89.3) | |
| High risk | 28 (100.0) | 3 (10.7) | |
| Subjects (n = 28) |
|||
|---|---|---|---|
| Before | After | P-value | |
| SF total score |
59.17 ± 11.83 | 86.38 ± 15.00 | < 0.001 |
| Physical Functioning (PF) | 41.93 ± 5.37 | 43.70 ± 3.62 | 0.094 |
| Role-Physical (RP) | 44.00 ± 5.05 | 49.50 ± 1.01 | < 0.001 |
| Bodily Pain (BP) | 49.50 ± 4.38 | 49.35 ± 2.75 | 0.881 |
| General Health (GH) | 55.21 ± 5.56 | 47.40 ± 3.45 | < 0.001 |
| Vitality (VT) | 50.32 ± 4.42 | 51.93 ± 2.05 | 0.085 |
| Social Functioning (SF) | 45.64 ± 2.98 | 49.58 ± 1.78 | < 0.001 |
| Role-Emotional (RE) | 47.61 ± 3.73 | 50.57 ± 1.57 | 0.001 |
| Mental Health (MH) | 54.11 ± 7.35 | 52.28 ± 2.15 | 0.195 |
Table 1. A comprehensive nutrition intervention program for study subjects
The nutrition education materials were edited and used with permission from the Korea Health Promotion Institute, tailored specifically for the elderly population.
Table 2. General characteristics of study subjects (n = 28)
Mean ± SD Underweight: ≤ 18.49 kg/m2, Normal: 18.5-22.99 kg/m2, Overweight: 23-24.99 kg/m2, Obesity: ≥ 25 kg/m2 BMI, Body mass index
Table 3. Chronic disease history by subject (n = 28)
Multiple responses were permitted, allowing for the assessment of subjects' diverse chronic disease histories.
Table 4. Changes of anthropometry and laboratory measurements from baseline to study end in the participants
Mean ± SD SBP, Systolic Blood Pressure; DBP, Diastolic Blood Pressure; LDL, Low-Density Lipoprotein; HDL, High-Density Lipoprotein; AI, Atherogenic Index
Table 5. Changes of the level and scores of NQ-E from baseline to study end in the participants
Mean ± SD NQ-E grade: Low (≥63.5), Medium (51.9-63.4), High (≤51.8) NQ-E, Nutrition Quotient for Elderly
Table 6. Changes in NSI1) checklist results (nutritional risk assessment) before and after the study of research subjects
Mean ± SD NSI, Nutritional Screening Initiative
Table 7. Changes in nutritional score of subjects using the NSI checklist before and after the study
Nutritional Risk Assessment Using the NSI Checklist: Low risk (≤2), Moderate risk (3-5), High risk (≥6)
Table 8. Changes in quality of Life (measured using SF-36K1) health survey) of subjects before and after the study
Mean ± SD Short Form 36-item Health Survey, Korean version Standardized SF-36 scores obtained through scientific calculations, allowing for simplified comparisons across dimensions and individuals in the study.


