
Articles
- Page Path
- HOME > Korean J Community Nutr > Volume 18(3); 2013 > Article
-
Original Article
- Association of Bone Mineral Density and Blood Pressure, Calcium Intake among Adult Women in Seoul, Kyunggi Area: Based on 2011 KNHANES
- Jae Ok Koo
-
Korean Journal of Community Nutrition 2013;18(3):269-282.
DOI: https://doi.org/10.5720/kjcn.2013.18.3.269
Published online: June 30, 2013
Department of Home Economics, Korea National Open University, Seoul, Korea.
- Corresponding author: Jae Ok Koo, Department of Home Economic Korea National Open University, Jonroku Dongsungdong 169, Seoul 110-791, Korea. Tel: (02) 3668-4643, Fax: (02) 3668-4188, cokoo@knou.ac.kr
• Received: May 10, 2013 • Revised: June 24, 2013 • Accepted: June 24, 2013
Copyright © 2013 The Korean Society of Community Nutrition
This is an Open-Access article distributed under the terms of the Creative Commons Attribution Non-Commercial License (http://creativecommons.org/licenses/by-nc/3.0/) which permits unrestricted non-commercial use, distribution, and reproduction in any medium, provided the original work is properly cited.
- 1,912 Views
- 0 Download
- 9 Crossref
Abstract
- This study was carried out to investigate bone mineral density (BMD), blood pressure, calcium, sodium intake and related biochemical variables, and to analyze the relationship between BMD, and blood pressure, physical characteristics, nutrient intakes of Korean adult women. The study subjects were 30~80years old, 513 women living in Seoul and Kyunggi area who participated in 2011 KNHANES. The study subjects were divided into three BMD groups; normal, n = 259 (50.4%), osteopenia, n = 169 (32.9%), and osteoporosis, n = 85 (16.7%). Average height and weight and fat free mass decreased with a decrease in BMD. Average BMD of normal, osteopenia, osteoporosis were 0.87, 0.79, 0.70 g/cm2, and T-score were 0.42, -0.66, -1.62, respectively. Higher systolic blood pressure, alkaline phosphatase, and triglyceride were significantly associated with a decrease in the BMD. The rates of hypertension were significantly increased from normal to osteoporosis. i.e. 18.5% in normal, 34.3% in osteopenia and 63.5% in osteoporosis. Average nutrientintakes such as protein, fat, calcium, phosphorus, iron, sodium, potassium, vitamin A, vitamin B, vitamin B2, and vitamin C were significantly lower in subjects with lower BMD.n. Average calcium intake of normal, osteopernia and osteoporosis were 528.50, 416.96, 389.56 mg, respectively. There were significant negative correlations between calcium, phosphorus and age, systolic blood pressure, triglyceride. Also, there were negative correlation systolic blood pressure (incomplete sentence). In this study, we found low BMD according to low calcium intake increase the risk of osteoporosis and hypertension rather than sodium intake, also calcium intake decreased with increase age. Therefore, in order to prevent osteoporosis and hypertension, subjects need to be educated regarding the importance of calcium nutrients in diet.
-
This research was supported by grants from Korea National Open University 2012 the second half.
NOTES
- 1. Angus RM, Sambrool PN, Pocock NA, Eisman JA. Dietary intake and bone mineral density. Bone Miner 1988; 4(3): 265-277.PubMed
- 2. Bae YJ, Sung CJ. A comparison between postmenopausal osteoporotic women and normal women of their nutrient intakes and the evaluation of diet quality. Korean J Community Nutr 2005; 10(2): 205-215.
- 3. Carbone LD, Bush AJ, Barrow KD, Kang AH. The relationship of sodium intake to calcium and sodium excretionand bone mineral density of the hip in postmenopausal African-American and Caucasian women. J Bone Miner Metab 2003; 21(6): 415-420.ArticlePubMedPDF
- 4. Chen J, Gu D, Huang J, Rao DC, Jaquish CE, Hixson JE, Chen CS, Lu F, Hu D, Rice T, Kelly TN, Hamm LL, Whelton PK, He J. Metabolic syndrome and salt sensitivity of blood pressure in non-diabetic people in China: a dietary intervention study. Lancet 2009; 373(9666): 829-835.ArticlePubMedPMC
- 5. Choi GH. The association of dietary habits and nutrent intakes with bone mineral density in Korean female college students. Soonchunhyang University; 2007; 15-29 Master thesis.
- 6. Choi JH, Kim SK. Comparison of the dietary factors between normal and osteopenia groups by bone mineral density in Korean female college students. J Korean Soc Food Sci Nutr 2008; 37(7): 869-878.Article
- 7. Choi MK, Lee WY, Park JD. Relation among mineral (Ca, P, Fe, Na, K, Zn) intakes, blood pressure and blood lipids in Korean adults. Korean J Nutr 2005; 38(10): 827-835.
- 8. Choi MJ. Effects of nutrient intake and exercise on bone mineral density and bone mineral content in premenopausal women. Korean J Nutr 2002; 35(4): 473-479.
- 9. Choi SN, Chung NY, Song CH, Kim SR. Bone density and nutrient intake of university students. Korean J Food Cult 2007; 22(6): 841-847.
- 10. Choi YJ, Im Ruth, La SH, Choi MK. Correlation between nutrient intakes and bone mineral density in carpus of female university students. J Korean Diet Assoc 2006; 12(1): 10-17.
- 11. Cussler EC, Going SB, Houtkooper LB, Stanford VA, Blew RM, Flint-Wagner HG, Metcalfe LL, Choi JE, Lohman TG. Exercise frequency and calcium intake predict 4-year bonechanges in postmenopausal women. Osteoporos Int 2005; 16(12): 2129-2141.ArticlePubMedPDF
- 12. Dawson-Hughes B, Dallal GE, Krall EA, Sadowski L, Sahyoun N, Tannenbaum S. A Controlled trial of the effect of calcium supplementation on bone density in postmenopausal women. N Engl J Med 1990; 323: 878-883.ArticlePubMed
- 13. Deng PY, Li YJ. Calcitonin gene-related peptide and hypertension. Peptides 2005; 26(9): 1676-1685.ArticlePubMed
- 14. Evans CE, Chughtai AY, Blumsohn A, Giles M, Eastell R. The effect of dietary sodium on calcium metabolism in premenopausal and postmenopausal women. Eur J Clin Nutr 1997; 51(6): 394-399.ArticlePubMedPDF
- 15. Franceschi RT. The role of ascorbic acid in mesenchymal differentiation. Nutr Rev 1992; 50(3): 65-70.ArticlePubMed
- 16. Han IK. Hormone replacement therapy for osteoporosis. J Korean Med Assoc 1995; 38(1): 42-48.
- 17. Han JH, Cho KH. Correlation between body composition and spinal bone density in young women. J Korean Acad Fam Med 2002; 23(2): 215-223.
- 18. Hong MS, Pak HO, Sohn CY. Comparative study of food behaviors and nutrients intake according to the bone mineral density of female university students. Korean J Food Nutr 2012; 25(1): 156-162.Article
- 19. Houston MC, Harper KJ. Potassium, magnesium and calcium: their role in both the cause and treatment of hypertension. J Clin Hypertens (Greenwich) 2008; 10(7 Suppl 2): 3-11.ArticlePubMedPMC
- 20. Ilich JZ, Kerstetter JE. Nutrition in bone health revisited: a story beyond calcium. J Am Coll Nutr 2000; 19(6): 715-737.ArticlePubMed
- 21. Islam MZ, Lamberg-Allardt C, Karkkainen M, Ali SM. Dietary calcium intake in premenopausal Bangladeshi women: do socio-economic or physiological factors play a role. Eur J Clin Nutr 2003; 57(5): 674-800.ArticlePubMedPDF
- 22. Jacqmain M, Doucet E, Despres JP, Bouchard C, Tremblay A. Calcium intake, body composition, and lipoprotein-lipid concentrations in adults. Am J Clin Nutr 2003; 77(6): 1448-1452.ArticlePubMed
- 23. Jang S, Sung CJ. A comparative study of the iron nutritional status of female collage women according to bone mineral density. Nutr Sci 2005; 8(1): 71-76.
- 24. Jeon JD. Prevalent status and associated factor of osteoporosis in adult women. Graduate School of Environment and Health Chosun University; 2000; 12-30 Master thesis.
- 25. Jeong HR, Yun SJ, Kim MH. Evaluation of food and nutrient intake by food frequency questionnaire between normal and risk groups according to the bone mineral density of female college students residing in Gangwon area. Korean J Community Nutr 2010; 15(4): 429-444.
- 26. Jeong SP, Lee GM, Lee SH. Factors affecting to bone mineral density in postmenopausal women. Yeungnam Univ J Med 1996; 13(2): 261-271.Article
- 27. Jolma P, Koobi P, Kalliovalkama J, Kahonen M, Fan M, Saha H, Helin H, Lehtimaki T, Porsti I. Increased calcium intake reduces plasma cholesterol and improves vasorelaxation in experimental renal failure. Am J Physiol Heart Circ Physiol 2003; 285(5): H1882-H1889.ArticlePubMed
- 28. Kannel WB, Larson M. Long-term epidemiologic prediction of coronary disease. Cardiology 1993; 82(2-3): 137-152.ArticlePubMed
- 29. Khandwala HM, Mumm S, Whyte MP. Low serum alkaline phosphatase activity and pathologic fracture: case report and brief review of hypophosphatasia diagnosed in adulthood. Endocr Pract 2006; 12(6): 676-681.ArticlePubMed
- 30. Kim BS. Comparisiom of related factors of bone mineral density of postmscenopausal women in urban and rural areas. Wonkwang University; 2007; 7-15 MS thesis.
- 31. Kim JM. An analysis of related factors and nutrients intake affecting bone mineral density of college women in Daegu area. J Korean Diet Assoc 2005; 11(1): 86-94.
- 32. Kim K, Son SM, Kim HK. Dietary and lifestyle factors associated with hypertension in Korean adolescents-based on 2005 Korean national health and nutrition examination survey-. Korean J Community Nutr 2011; 16(4): 439-453.Article
- 33. Kim MC, Choi JH, Kim TH, Hong IP, Park HS. Womens recognition about postmenopusal osteoporosis. J Korean Acad Fam Med 1995; 16(5): 298-306.
- 34. Kim MS. Analysis of bone density risk factors in women living in Seoul area. Korea National Open University; 2006; 35-55 MS thesis.
- 35. Kim MS, Koo JO. Comparative analysis of food habits and bone density risk factors between normal and risk women living in the Seoul area. Korean J Community Nutr 2008; 13(1): 125-133.
- 36. Kim SG. The studies on the relationship of bone mineral density, physical activity and immunological factor in adults. The graduate school of Woosuk University; 2009; 18-55 Ph.D dissertation.
- 37. Koo S, Kim YO, Kim MK, Yoon JS, Park K. Nutrient intake, lifestyle factors and prevalent hypertension in Korean adults: results from 2007-2008 Korean national health and nutrition examination survey. Korean J Community Nutr 2012; 17(3): 329-340.Article
- 38. Koo JO, Park SY. Analysis of BMI menopose, blood pressure and dietary habits affecting born mineral density of 30~60 years women. Korean J Community Nutr 2010; 15(3): 403-414.
- 39. Korean National Health and Nutrition Examination Survey [KNHANES]. Korea national health & nutritionexamination survey. 2011; cited 2013 March 2]. Available from http://knhanes.cdc.go.kr.
- 40. Korean National Statistical Office. The statistics of aging population 2011. 2011a; cited 2013 March 25]. Available from http://www.kosis.kr.
- 41. Korean National Statistical Office. The statistics of chronic disease 2011. 2011b; cited 2013 March 15]. Available from http://www.kosis.kr.
- 42. Korean National Statistical Office. The statistics of life table 2012. cited 2013 April 1]. Available from http://www.kosis.kr.
- 43. Lee EN. Comparison of bone mineral density and risk factors of osteoporosis between normal and rheumatbone arthritis in postmenopausal women. J Faecrratol Health 2000; 7(1): 89-101.
- 44. Lee EY. Lifestyle behaviors affecting bone mineral density in peri-mnopausal women. 2003; Ewha Womans University; 7-28 MS thesis.
- 45. Lee HJ, Lee HY. A study on the bone mineral density and related factors in Korean postmenopausal women. Korean J Nutr 1999; 32(2): 197-203.
- 46. Lee JS, Yu CH, Chung CE. Relation between milk consumption and bone mineral density of female college students in Korea. Korean J Nutr 2006; 39(5): 451-459.
- 47. Lee JW, La HS, Kwak CS. Dietary factors and serum and urinary electrolytes affecting blood pressure in adolescents. Korean J Community Nutr 1996; 1(1): 61-70.
- 48. Lee KG. The Correlation between bone mineral status and body composition, muscle strength, blood biochemical, and blood pressure in Korean women. Kyung Hee University; 2007; 14-49 Ph.D dissertation.
- 49. Lee SH. Association of bone mineral density with dietary intake and health-related behavior among Korean postmenopausal women. Myong-ji University; 2012; 25-76 Ph.D dissertation.
- 50. Lee UJ. The relationship of bone density and eating habits nutritional intake in adult females. Keimyung University; 2005; 14-42 MS thesis.
- 51. Lynch SR. Iron overload-prevalence and impact on heart. Nutr Rev 1995; 53(9): 255-260.PubMed
- 52. Marcus R, Dalsky G, Raab D, Slemenda C, Snow-Harter C. Osteoporosis and exercise in women. Med Sci Sports Exerc 1992; 24: 6 Suppl. S301-S307.PubMed
- 53. Miura K, Okuda N, Turin TC, Takashima N, Nakagawa H, Nakamura K, Yoshita K, Okayama A, Ueshima H. Dietary salt intake and blood pressure in a representative Japanese population: baseline analyses of NIPPON DATA 80. J Epidemiol 2010; 20: Suppl 3. S524-S530.ArticlePubMedPMC
- 54. Na HB. Factors affecting bone mineral density in Korean women by menopause. Korean J Community Nutr 2004; 9(1): 73-80.
- 55. Na NS. A study on factors related to bone density of women living in Seoul. Korea National Open University; 2009; 36-50 MS thesis.
- 56. Oh SI, Lee HS, Lee MS, Kim CI, Kwon IS, Park SC. Some factors affecting bone mineral status of premenopausal women. Korean J Community Nutr 2003; 8(6): 927-937.
- 57. Park SJ, Ahn Y, Min HS, Oh KS, Park C, Cho NH, Kimm K. Osteoporosis prevalence of radius and tibia and related factors using multiple bone sites quantitative ultrasound measurement of the Korean health and genome study cohort women. Korean J Community Nutr 2005; 10(4): 536-545.
- 58. Park YS, Heo JM, Kang MI, Kim DY, Min YK, Park HM, Yoon HG, Lee DH, Lee EJ, Lee HH, Chung HY, Byun DW. Nutrient intake and osteoporosis: a case-control study in Korean postmenopausal women. Korean J Bone Metab 2009; 16(2): 103-110.
- 59. Prockop DJ. Role of iron in the synthesis of collagen in connective tissue. Fed Proc 1971; 30(3): 984-990.PubMed
- 60. Riis BJ. Biochemical markers of bone turn over.II: Diagnosis, prophylaxis, and treatmentofosteoporosis. Am J Med 1993; 95(5A): 17S-21S.ArticlePubMed
- 61. Roughead ZK, Johnson LK, Lykken GI. The effects of interaction of dietary protein and calcium on calcium retention: A controled feeding study. J Bone Miner Res 2004; 19: Suppl 1. S302.
- 62. Shin YJ, Shin BK, Kim HJ, Won YJ. Osteoporosis & nutrition. J Korean Soc Osteoporos 2006; 4(2): 59-69.
- 63. Snow-Harter C, Bouxsein ML, Lewis BT, Carter DR, Marcus R. Effects of resistance and endurance exercise on bone mineral status of young women: a randomized exercise intervention trial. J Bone Miner Res 1992; 7(7): 761-769.ArticlePubMedPDF
- 64. Son SM, Huh GY. Dietary risk factors associated withhypertension in patients. Korean J Community Nutr 2006; 11(5): 661-672.
- 65. Song YJ, Paik HY. Effect of dietary factors on bone mineral density in Korean college women. Korean J Nutr 2002; 35(4): 464-472.
- 66. Song YJ, Paik HY. Effect of dietary, biochemical and other factors on bone mineral density change for 2 year in Korean college women. Korean J Nutr 2003; 36(2): 175-182.
- 67. Sung CJ, Choi SH, Kim MH, Choi YH, Lee DH, Baek SK, Kim HK, Choi MK. A study of nutritional status, maternal factors and lifestyles according to BMD in rural postmenopausal women. Korean J Community Nutr 2001; 6(2): 192-204.
- 68. Suter PM, Sierro C, Vetter W. Nutritional Factors in the control of blood pressure and hypertension. Nutr Clin Care 2002; 5: 9-19.PubMed
- 69. Swezey RL. Exercise for osteoporosis-is walking enough. Spine (Phila Pa 1976) 1996; 21(23): 2809-2813.ArticlePubMed
- 70. The Korean Nutrition Society. Dietary reference intakes for Koreans (DRIs for Koreans). 2010.
- 71. Uusi-Rasi K, Sievanen H, Pasanen M, Oja P, Vuori I. Associations of calcium intake and physical activity wity bone density and size in premenopausal and postmenopausal women:a peripheral quantitative computed tomography study. J Bone Miner Res 2002; 17(3): 544-552.PubMed
- 72. Vasdev S, Longerich L, Singal P. Nutrition and hypertension. Nutr Res 2002; 22: 111-123.
- 73. Vaskonen T. Dietary minerals and modification of cardiovascular risk factors. J Nutr Biochem 2003; 14: 492-506.ArticlePubMed
- 74. Yeon JY, Sung CJ. A study on dietary mineral intakes, urinary mineral excretions, and bone mineral density in Korean postmenopausal women. Korean J Community Nutr 2011; 16(5): 569-579.Article
- 75. You MH, Son BS, Park JA, Kim JO, Yang WH. Patterns of bone mineral density of adult women and its causal factors in Suwon Korea. Korean J Sanit 2004; 19(3): 71-80.
- 76. Youk JI. Female bone mineral density in an urban area and its relation with contributing factors. Chungnam National University; 2004; 6-20 MS thesis.
- 77. Yu CH, Lee YS, Lee JS. Some factors affecting bone density of Korean college women. Korean J Nutr 1998; 31(1): 36-45.
- 78. Yu CH, Kim HS, Lee JS, Kim JY. A study on Ca and P balance in Korean adult women. Korean J Nutr 2001; 34(1): 54-61.
REFERENCES
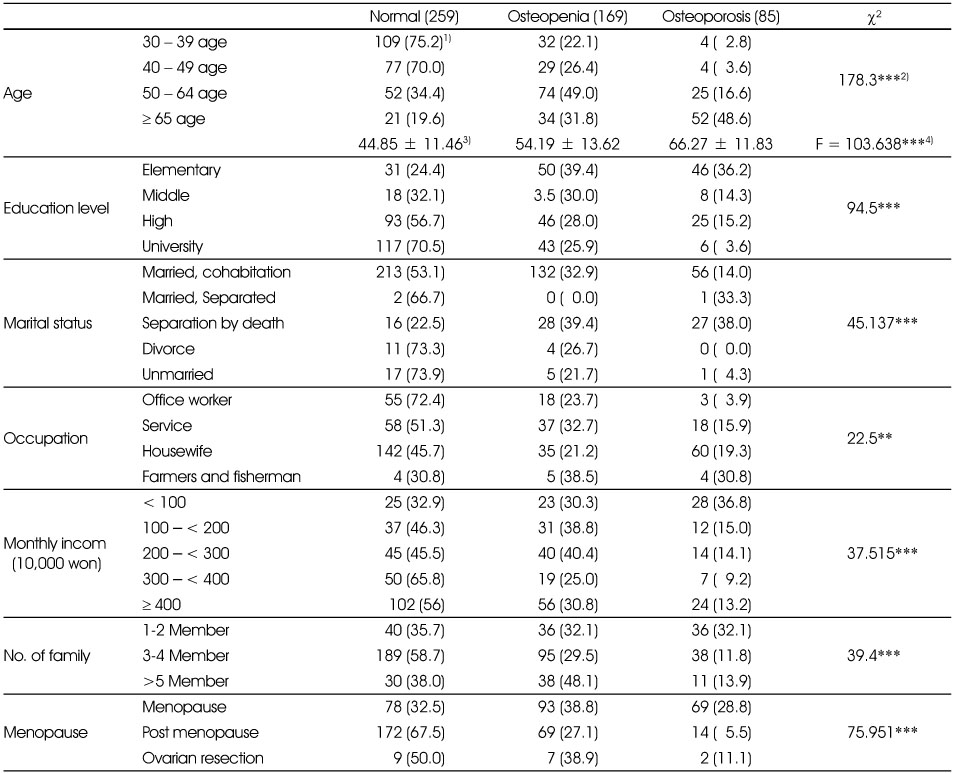
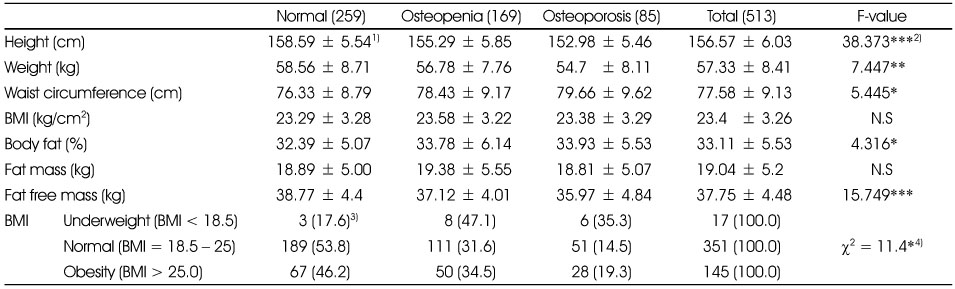
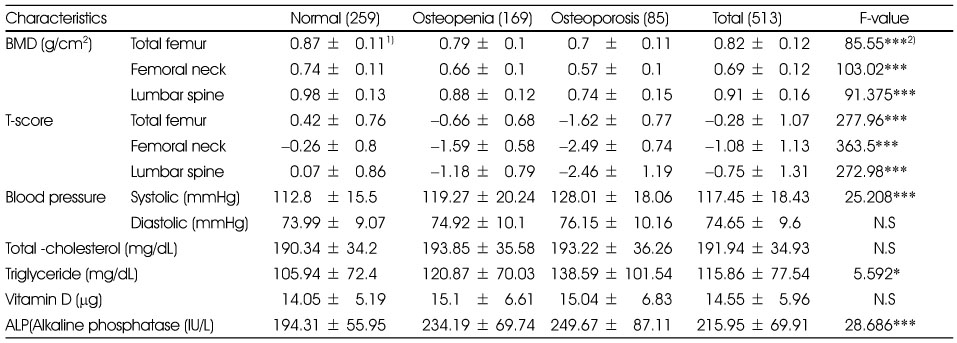
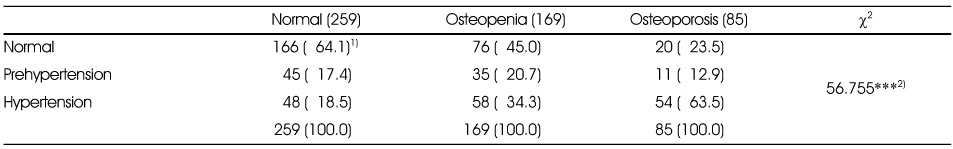
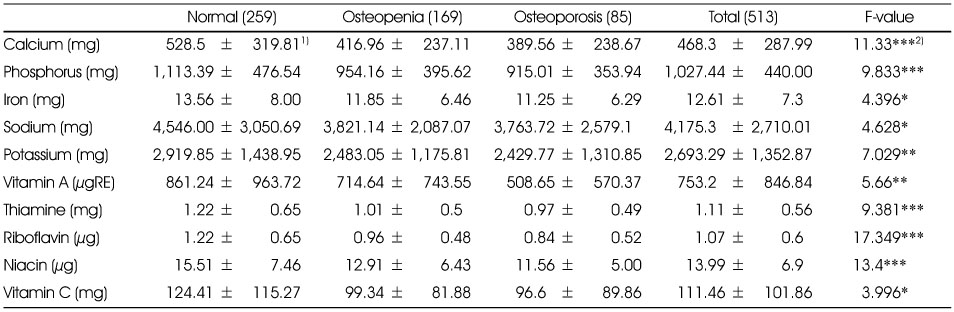
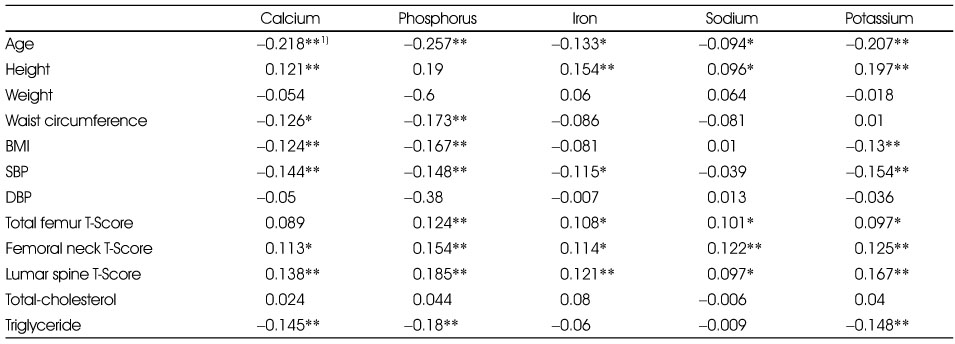
Figure & Data
REFERENCES
Citations
Citations to this article as recorded by 
- Developing the Osteoporosis Risk Scorecard Model in Korean Adult Women
Ilsu Park
Journal of Health Informatics and Statistics.2021; 46(1): 44. CrossRef - Dietary behaviors and nutritional status according to the bone mineral density status among adult female North Korean refugees in South Korea
Su-Hyeon Kim, Soo-Kyung Lee, Sin-Gon Kim
Journal of Nutrition and Health.2019; 52(5): 449. CrossRef - Effects of Nutrition Education at a Community Health Center on Overweight and Obese Middle-aged Women in Jeonbuk Area-Focused on Personalized Daily Energy Requirement and Food Exchange Units
Se-Yeon Kim, Sook-Bae Kim
Korean Journal of Community Nutrition.2017; 22(4): 307. CrossRef - Prevalence of Osteopenia/Osteoporosis and Related Risk Factors of Men Aged 50 Years and Older: Korea National Health and Nutrition Examination Survey 2010~2011 Data
Hye-Sang Lee
Journal of the Korean Dietetic Association.2016; 22(2): 106. CrossRef - The Effects of Korean DASH Diet Education with Calcium/Vitamin D Supplements on Nutrient Intakes, Food Consumption, Bone Turnover Markers and Bone Mineral Density among Korean Elderly Women
Haeyoung Lee, Smi Choi-Kwon, Seung-Hye Choi
Korean Journal of Adult Nursing.2015; 27(1): 94. CrossRef - Various Factors Affecting the Bone Mineral Density in Korean Young Adult Women: Data from the Fifth Korea National Health and Nutrition Examination Survey (KNHANES V), 2010~2011
Kwang-Hyun Jho, Soon-Nam Choi, Nam-Yong Chung
Journal of the Korean Dietetic Association.2014; 20(2): 110. CrossRef - Association of Anthropometric and Biochemical Factors with Bone Mineral Density in Korean Adult Women Data from the Fourth (2008~2009) and Fifth (2010~2011) Korea National Health and Nutrition Examination Surveys (KNHANES IV & V)
Soon-Nam Choi, Kwang-Hyun Jho, Nam-Yong Chung
Journal of the Korean Dietetic Association.2014; 20(3): 157. CrossRef - Analysis of Bone Mineral Density, Biochemical Index and Nutrient Intakes of 30-70 Years Old Women: Based on 2011 KNHANES
Jae Ok Koo, Myung Sook Kim
Korean Journal of Community Nutrition.2014; 19(4): 328. CrossRef - Factors associated with the bone mineral density in Korean adults: Data from the 2010-2011 Korean National Health and Nutrition Examination Survey (KNHANES) V
Kyung Sook Kim
Journal of agricultural medicine and community health.2014; 39(4): 240. CrossRef
 Cite
CiteAssociation of Bone Mineral Density and Blood Pressure, Calcium Intake among Adult Women in Seoul, Kyunggi Area: Based on 2011 KNHANES
Association of Bone Mineral Density and Blood Pressure, Calcium Intake among Adult Women in Seoul, Kyunggi Area: Based on 2011 KNHANES
Socio-demographic characteristics of the subjects by BMD
1) N (%)
2) By the χ2-test
3) Mean ± SD
4) Significantly different between groups by ANOVA
**: p < 0.01, ***: p < 0.001
Anthropometric charactertics and body composition of the subject by BMD
1) Mean ± SD
2) Significantly different between groups by ANOVA
3) N (%)
4) By the χ2-test
*: p < 0.05, **: p < 0.01, ***: p < 0.001
Bone mineral density, T-score, blood pressure and biochemical variables by BMD
1) Mean ± SD
2) Significantly different between groups by ANOVA
*: p < 0.05, ***: p < 0.001
Normal and hypertension distribution by BMD
1) N (%)
2) By the χ2-test
***: p < 0.001
Comparison of nutrients intake by bone mineral density
1) Mean ± SD
2) Significantly different between groups by ANOVA
*: p < 0.05, **: p < 0.01, ***: p < 0.001
Correlation coefficients between mineral intakes and anthropometrics, age, blood prssure, BMD
1) Significant correlation by Person's correlation coefficient(r)
*: p < 0.05, **: p ± 0.01
Table 1
Socio-demographic characteristics of the subjects by BMD
1) N (%) 2) By the χ2-test 3) Mean ± SD 4) Significantly different between groups by ANOVA **: p < 0.01, ***: p < 0.001
Table 2
Anthropometric charactertics and body composition of the subject by BMD
1) Mean ± SD 2) Significantly different between groups by ANOVA 3) N (%) 4) By the χ2-test *: p < 0.05, **: p < 0.01, ***: p < 0.001
Table 3
Bone mineral density, T-score, blood pressure and biochemical variables by BMD
1) Mean ± SD 2) Significantly different between groups by ANOVA *: p < 0.05, ***: p < 0.001
Table 4
Normal and hypertension distribution by BMD
1) N (%) 2) By the χ2-test ***: p < 0.001
Table 5
Comparison of nutrients intake by bone mineral density
1) Mean ± SD 2) Significantly different between groups by ANOVA *: p < 0.05, **: p < 0.01, ***: p < 0.001
Table 6
Correlation coefficients between mineral intakes and anthropometrics, age, blood prssure, BMD
1) Significant correlation by Person's correlation coefficient(r) *: p < 0.05, **: p ± 0.01


