The impact of flash continuous glucose monitoring and nutrition coaching on dietary self-efficacy and weight management in university students: a pre-post intervention study
Article information

Abstract
Objectives
This study aimed to evaluate the impact of a 4-week multicomponent intervention combining flash continuous glucose monitoring (flash-CGM), group nutrition education, and personalized nutrition coaching on dietary self-efficacy (DSE) and weight management in healthy university students.
Methods
A total of 27 university students participated in a pre-post intervention study. The intervention included a single 4-hour group-based nutrition education session, flash-CGM usage (FreeStyle Libre; Abbott Diabetes Care), and weekly one-on-one nutrition coaching. Participants wore the CGM device for 28 days (replaced after 14 days), and were guided in using the FoodLens app (DoingLab) for dietary tracking and a mobile app-linked digital scale for weight monitoring. Outcomes measured before and after the intervention included DSE, body mass index (BMI), nutrition quotient (NQ) and glycemic indicators. Statistical analyses included Wilcoxon signed-rank and Mann-Whitney U-tests with significance set at P < 0.05.
Results
There was a significant increase in DSE (P < 0.05), particularly in managing eating behavior under stress and fatigue. A modest but significant decrease in BMI was observed in the overall group (P < 0.05), though changes were not significant in the BMI ≥ 23 kg/m2 subgroup. Glycemic indicators showed minimal changes. The overall NQ score improved slightly, with significant increases in fruit intake (P < 0.01) and nutrition label checks (P < 0.05). High satisfaction levels (4.52 ± 0.65 on a 5‑point scale) were reported for device usability and coaching services.
Conclusion
The multicomponent intervention improved DSE, NQ scores, and supported modest weight reduction among university students. The combined effect of CGM, nutrition education, and coaching appears promising; however, further studies are needed to isolate the effects of each component and evaluate long-term outcomes. Trial Registration: Clinical Research Information Service Identifier: KCT0010255.
Trial Registration
Clinical Research Information Service Identifier: KCT0010255.
INTRODUCTION
The transition from adolescence to early adulthood represents a critical phase for establishing lifelong dietary habits [1]. Addressing this phase with targeted dietary interventions is crucial for preventing the onset of chronic conditions and promoting long-term well-being. University students, in particular, face unique challenges such as increased social engagements, diverse living arrangements (e.g., dormitories or shared apartments), and irregular eating patterns [1, 2]. The 2021 Korea National Health and Nutrition Examination Survey highlighted these issues, reporting that adults in their 20s have the highest breakfast skipping rates (53.0%) and lowest rates of healthy dietary practices (38.0%) [3]. This age group is also characterized by frequent consumption of convenience store meals, delivery food, and processed foods, prioritizing taste and convenience over health [2, 4]. Despite recognizing the importance of health management, only 4.0% of individuals in this age group have experienced formal nutrition education, significantly lower than other age groups [5].
During the COVID-19 pandemic, university students experienced a further decline in dietary quality, with reduced physical activity, increased weight gain, irregular eating patterns, and greater reliance on processed and delivery foods [6]. Although students understand the significance of health management [7], they often struggle to adopt health-promoting behaviors, emphasizing the need for targeted nutrition education programs.
Digital health tools, such as smartphone-based nutrition education [2, 8, 9] and continuous glucose monitoring (CGM), provide promising solutions for real-time dietary feedback. CGM, particularly the flash-CGM such as FreeStyle Libre (Abbott Diabetes Care), provides minimal invasiveness, ease of use, and continuous glucose tracking without finger-prick blood samples. The device measures glucose levels in interstitial fluid providing immediate visual feedback through a smartphone app. This real-time data enhances dietary awareness and supports behavioral adjustments, potentially benefiting even healthy populations. While CGM has demonstrated efficacy in managing glycemic control and promoting dietary behavior change in individuals with and without diabetes [10-14], the application of CGM outside diabetic populations remains debated [15], with emerging evidence suggesting heightened dietary awareness and behavior modification. Klonoff et al. [16] noted the increasing adoption of CGM for promoting healthy behaviors and metabolic awareness in non-diabetic populations. However, research exploring the practical benefits and challenges of CGM among healthy young adults remains limited.
To address this gap, the present study investigates the impact of a short-term multicomponent intervention, combining flash-CGM, structured group-based nutrition education, and tailored nutrition coaching, on dietary self-efficacy (DSE) and weight management in this population. We hypothesize that real-time feedback from CGM as part of this multicomponent approach will enhance dietary behaviors, particularly among individuals with higher body mass index (BMI).
METHODS
Ethics statement
The informed written consent was obtained from each participant. The study protocol was approved by the Institutional Review Board of Semyung University (2024-05-003-03), and the clinical research Information Service (approval number: KCT0010255).
1. Study design
This study was conducted as a pre-post intervention study and reported in accordance with the Strengthening the Reporting of Observational Studies in Epidemiology (STROBE) statement, available at https://www.strobe-statement.org/.
2. Intervention period and participants
This study was conducted over four weeks from September to October 2024. The four-week duration was selected to balance feasibility and the potential for meaningful dietary behavior changes within a manageable time frame for university students, given their academic schedules and the study's logistical constraints. This period was also informed by prior research suggesting that short-term interventions can yield measurable improvements in DSE and related outcomes [17-19].
Participants included 27 university students enrolled in an extracurricular program on digital bio-healthcare using AIoT at Semyung University in Chungbuk, South Korea. Inclusion criteria included ownership of a smartphone and no diagnosis of diabetes. Initially, 40 students attended a briefing session and provided written consent; however, after excluding those with incomplete survey responses or who missed post-intervention assessments, the final sample size was 27, resulting in a 32.5% dropout rate.
Study design and the weekly research progress is presented in Fig. 1.
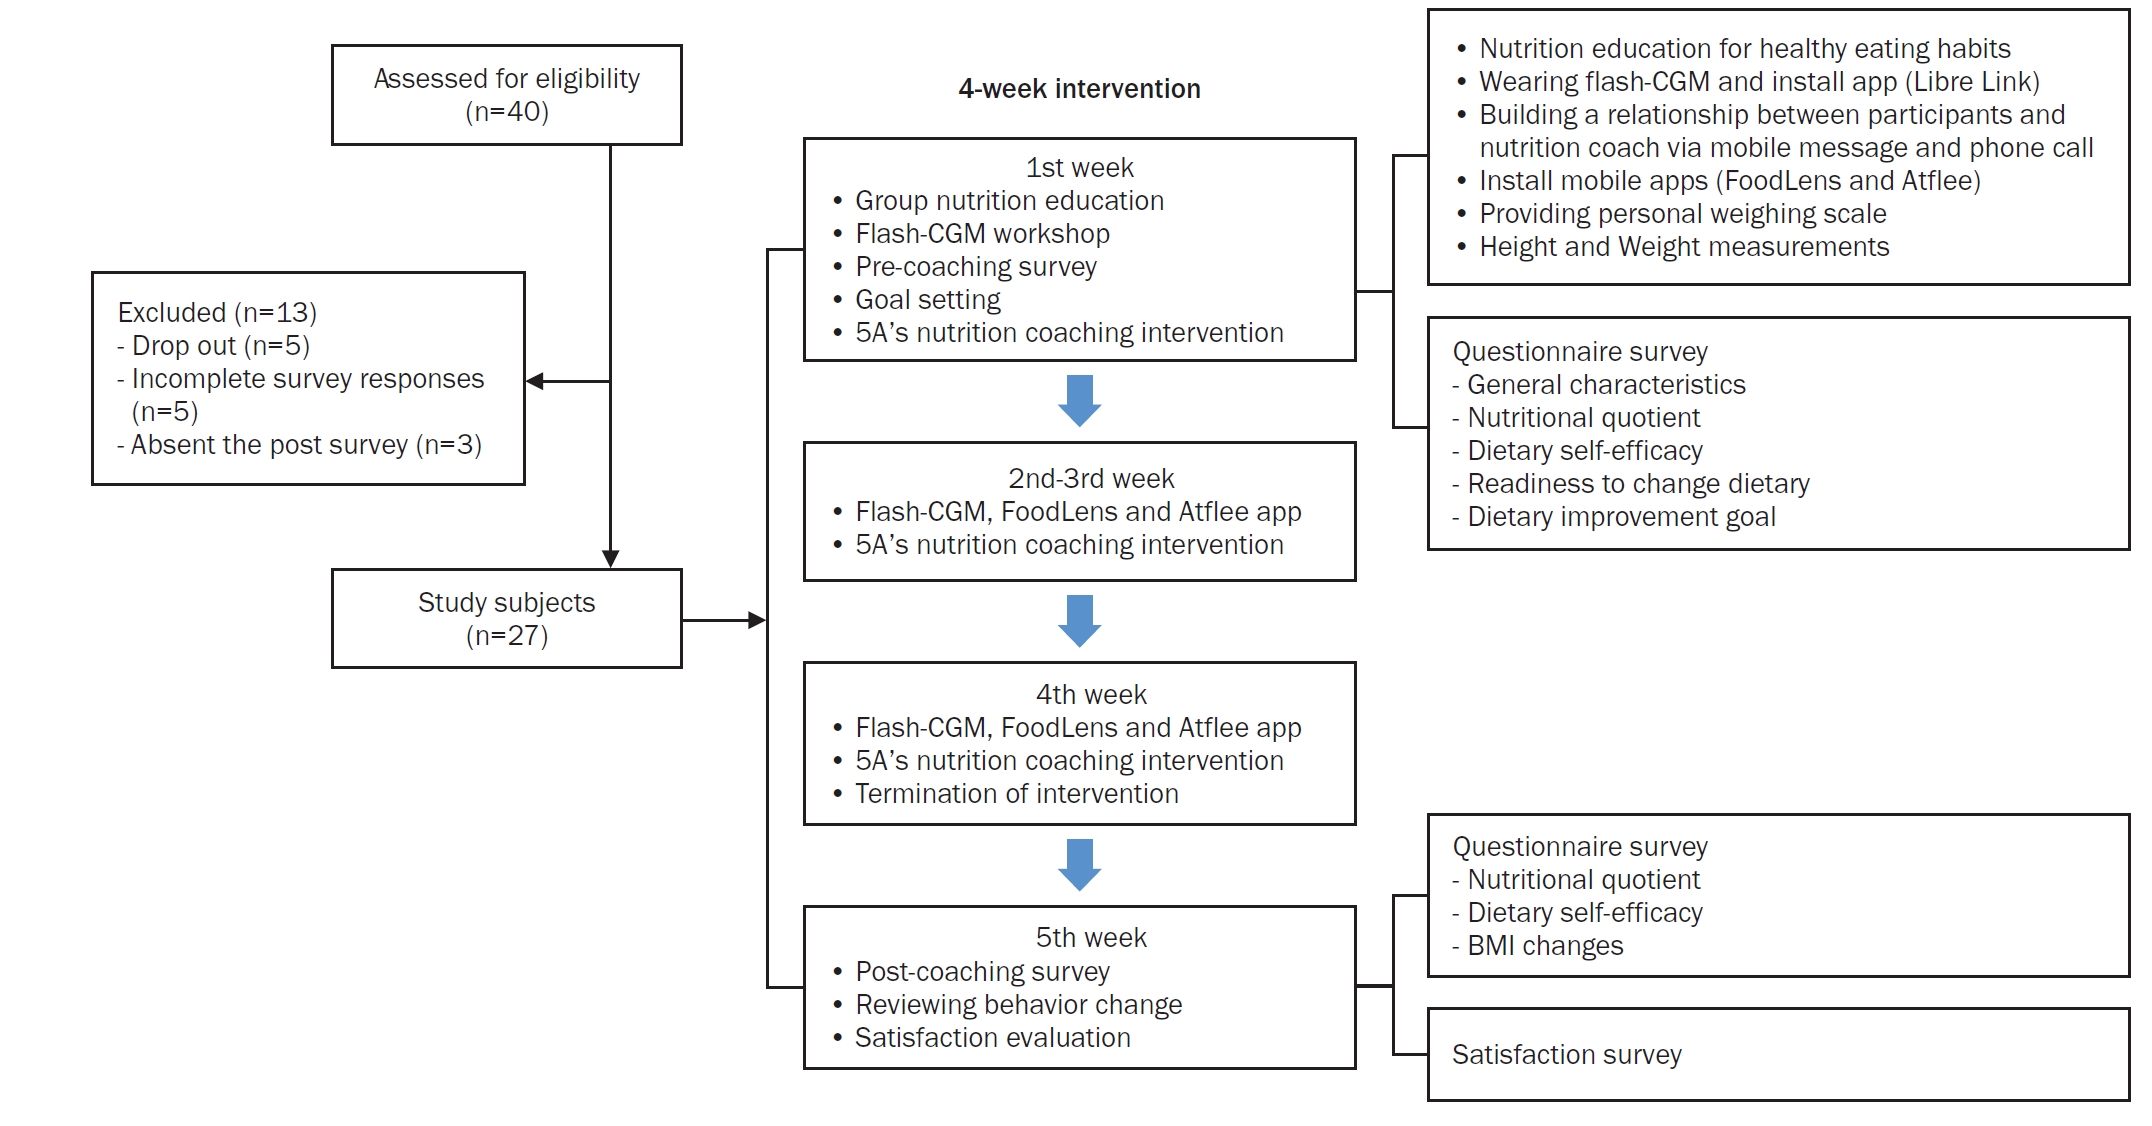
Study design and flow of the 4-week multicomponent intervention. The intervention included baseline surveys, a 4-hour group nutrition education and flash-CGM workshop (week 1), weekly 5A’s-based nutrition coaching, app-based dietary and weight monitoring and a post-intervention evaluation (week 5). A total of 40 participants were screened, with 27 completing the study. CGM, continuous glucose monitoring; BMI, body mass index.
3. Intervention components
At baseline, participants selected one dietary improvement goal from five options: nutritional balance, regular eating habits, impulse control, weight loss, or disease prevention. Also, the readiness for dietary habit change was scored on a scale from 1 (not at all) to 10 (very much).
The intervention consisted of: (1) A 4-hour group-based nutrition education session covering healthy eating principles and interpretation of CGM data as shown in Table 1. (2) Flash-CGM device (FreeStyle Libre), worn for 14 days and replaced once to cover the full 28-day period. Data were collected via the LibreLink and LibreView platforms. And (3) Weekly individual nutrition coaching sessions (average 15–30 minutes) were conducted via a KakaoTalk (Kakao Corp.) channel, guided by the 5A’s model: assess, advise, agree, assist, and arrange for self-management support provided with the Gluet: glucose diet textbook [20]. Table 2 outlines the weekly topics covered during the intervention. For instance, participants with frequent post-meal glucose spikes were advised to increase fiber intake and reduce simple carbohydrates. Also, participants used the FoodLens mobile app (DoingLab) for dietary tracking and a Bluetooth-linked digital scale (Atflee T9; Guangdong Welland Technology Co.) for self-weight monitoring. The study protocol is illustrated in Fig. 1, showing the sequencing of educational sessions, CGM use, mobile app integration, and pre/post assessments over the 5-week schedule.

Baseline group nutrition education session

4. Outcome measurements
The primary outcome of this study was DSE, and the secondary outcomes included BMI, nutrition quotient (NQ), and glycemic indicators. The DSE questionnaire was based on previous research [2, 21, 22]. DSE assessed using a 13-item questionnaire evaluating emotional regulation efficacy (7 items) and environmental cue control efficacy (6 items) on a 10-point scale, with higher scores indicating greater self-efficacy. Reliability coefficients were 0.874 (pre-test) and 0.896 (post-test).
The NQ questionnaire survey [23] including 20 items categorized into balance, moderation, and practice dimensions, and 7 items on general characteristics of the participants. The NQ for adults was used as a tool to evaluate dietary quality and nutritional status, based on the revised 2021 guidelines. The domain-specific scores, total scores, and grades were determined using the methodology outlined by Yook et al. [23].
Average glucose and estimated glycated hemoglobin (HbA1c) were derived from CGM data using the LibreView platform, based on 14-day glucose profiles. Estimated HbA1c was calculated as (mean glucose [mmol/L] + 2.59) / 1.59 [24].
BMI was used to standardize for height and for consistency with previous studies, even though body weight may be more sensitive over short durations. BMI changes were taken at baseline and week 5. BMI was calculated using the formula: weight / [height]2, where weight was measured in kilograms (kg) using a calibrated digital scale (InBody 720; InBody Co., Ltd.) and height was measured in meters (m) using a standardized stadiometer (DS-103; Dong Sahn Jenix Co. Ltd.). FoodLens data were not analyzed due to incomplete records.
At the end of the study, the satisfaction survey included 15 items on a 5-point Likert scale assessing educational effectiveness, device usability, coaching satisfaction, and behavioral changes. All the survey was administered via online using Google Forms (Google).
5. Statistical analysis
Data were analyzed using IBM SPSS statistics (version 28; IBM Corp.). The Wilcoxon signed-rank test was chosen to evaluate pre- and post-intervention changes in DSE, BMI, NQ, and glycemic indicators. Mann-Whitney U-test was used to compare changes between BMI subgroups (< 23 and ≥ 23 kg/m2). These tests were appropriate given the small sample size and potential deviations from normality. To control for type I error due to multiple comparisons, Bonferroni corrections were applied where applicable, ensuring the robustness of the statistical inferences. Statistical significance was set at P < 0.05. The sample size was calculated using G*Power (version 3.1.9.7). With an effect size of f = 0.25 (medium), a significance level of α = 0.05, and power (1–β) = 0.80, the minimum required sample size was determined to be 27 participants. The final sample size in this study met this requirement. Effect sizes (r) were calculated for Wilcoxon signed-rank and Mann-Whitney U-tests using the formula r = Z / √N, where Z is the test statistic and N is the number of observations. According to Cohen’s criteria, r values of 0.1, 0.3, and 0.5 represent small, medium, and large effect sizes, respectively.
RESULTS
1. Participant characteristics
Table 3 presents the general characteristics of the participants. The mean age of the participants was 20.33 ± 1.71 years, and 59.3% were female. Among the participants, 48.2% resided in dormitories, the majority were non-smokers (77.8%), and 74.1% reported infrequent alcohol consumption. More than half (55.6%) reported not using dietary supplements. None of the participants had received nutrition coaching in the past year. Based on BMI (kg/m2) classification, 48.1% of the participants were categorized as underweight or normal weight, while 51.9% were classified as overweight or obese.

General characteristics of the participants
Table 4 shows that the primary dietary goals among participants were weight loss (55.6%, n = 15), notably higher in the BMI ≥ 23 kg/m2 group (71.4%) compared to BMI < 23 kg/m2 (38.5%). Other frequently reported goals included achieving a nutritionally balanced diet (22.2%, predominantly BMI < 23 kg/m2), establishing regular eating habits (14.8%), correcting impulsive eating (3.7%), and disease prevention through diet (3.7%). Participants’ overall readiness to change dietary habits, assessed on a 10-point scale before the intervention, was moderately high (7.85 ± 1.54). There were no significant differences between BMI groups (BMI ≥ 23 kg/m2: 8.07 ± 1.49; BMI < 23 kg/m2: 7.62 ± 1.61; P = 0.370). Data are not shown.

Primary dietary goals reported by participants according to BMI group
2. Changes in dietary self-efficacy
Table 5 shows that the intervention significantly improved participants’ DSE in various dimensions, including affective factor control efficacy and environmental stimulus control efficacy. Participants demonstrated significant improvements in their ability to resist eating under various emotional conditions. Significant improvements were noted in the ability to resist eating when stressed (from 5.78 ± 2.76 to 7.52 ± 1.67, P < 0.01, r = 0.510) and tired (from 5.70 ± 2.71 to 8.74 ± 1.40, P < 0.001, r = 0.577) in total. Interestingly, the ability to control eating when tired significantly improved across both BMI categories. Notably, participants with BMI < 23 kg/m2 exhibited the improvement to resist eating when tired (from 4.85 ± 2.67 to 9.15 ± 0.90, P < 0.01), nervous (from 8.15 ± 1.52 to 9.54 ± 0.78, P < 0.01) and when feeling unstable (from 7.85 ± 1.63 to 9.00 ± 1.15, P < 0.05). Subtotal scores for this dimension showed a significant improvement from 6.97 ± 1.81 to 8.03 ± 1.41 (P < 0.01) in total. Improvements were also observed in participants’ ability to resist eating in response to external stimuli, although the changes were less pronounced compared to the affective domain. The ability to resist eating in social settings, such as with friends, increased significantly from 4.96 ± 2.67 to 6.30 ± 2.37 in total (P < 0.05). Subtotal scores for this dimension improved from 6.69 ± 1.72 to 7.30 ± 1.50, although the change was not statistically significant.

Changes in dietary self-efficacy scores by intervention according to BMI group
Overall, the total DSE score improved significantly from 6.84 ± 1.64 to 7.69 ± 1.26 (P < 0.05). The improvement was particularly notable among participants with BMI < 23 kg/m2, where the total score increased from 6.49 ± 1.36 to 7.89 ± 1.06 (P < 0.01).
3. Changes in body mass index
Fig. 2 displays the outcomes of the pre- and post-intervention in BMI. A statistically significant decrease in BMI was observed among the total sample (from 24.51 ± 5.71 to 24.29 ± 5.67, P < 0.05), while subgroup analysis for BMI ≥ 23 kg/m2 showed no significant change. BMI significantly decreased after the intervention (P = 0.045, r = 0.393), indicating a medium effect size. Among participants with BMI ≥ 23 kg/m2, a non-significant reduction in BMI was observed (P = 0.153, r = 0.394), suggesting a moderate effect size despite statistical insignificance.

Changes in BMI before and after the intervention by group. BMI significantly decreased in the total sample (*P < 0.05). No statistically significant changes were observed in the BMI < 23 kg/m2 and BMI ≥ 23 kg/m2 subgroups. BMI, body mass index; ns, not significant.
4. Changes in glycemic indicators
Table 6 presents the changes in glycemic indicators from pre- and post-intervention assessments. The intervention did not lead to statistically significant changes in glycemic indicators, including overall blood glucose variability, and estimated HbA1c. The overall blood glucose variability remained stable, with pre-intervention levels of 105.75 ± 11.47 mg/dL compared to 104.77 ± 9.40 mg/dL post-intervention (P = 0.822, r = 0.046). Similarly, the estimated HbA1c levels showed no significant change, with pre-intervention levels of 5.26% ± 0.32% compared to 5.24% ± 0.33% post-intervention (P = 0.863, r = 0.033).

Changes in glycemic indicators
5. Changes in nutrition quotient scores
Table 7 presents the results in NQ scores before and after the intervention. Although the total NQ score did not significantly improve (P = 0.485, r = 0.136), small to medium effect sizes were observed for several individual NQ items, such as fruit intake (P = 0.008, r = 0.894) and labeling check (P = 0.048, r = 0.471), suggesting meaningful behavioral changes (Table 8).

Changes in the NQ score of respective dimension

Changes in the NQ score of each question according to BMI group
In Table 8, intake frequency of fruits showed a statistically significant increase from 1.63 ± 0.49 to 1.89 ± 0.58 (P < 0.01) in total. Participants with BMI < 23 kg/m2 exhibited a significant rise from 1.69 ± 0.48 to 2.00 ± 0.71 (P < 0.05). Nutrition labeling check when eating out or purchasing processed foods significantly improved from 2.59 ± 1.15 to 3.22 ± 1.34 (P < 0.05) in total.
6. Satisfaction survey
Table 9 presents the satisfaction evaluation after the completion of the entire program. Participants reported high levels of satisfaction with the flash-CGM device and the accompanying nutrition coaching services. The overall satisfaction score was 4.52 ± 0.65 on a 5-point Likert scale. Participants acknowledged the effectiveness of nutrition education in helping them understand postprandial glucose changes (4.67 ± 0.55) and found the provided materials easy to understand (4.74 ± 0.45). The flash-CGM device was rated highly for its usability, with participants finding it easy to monitor blood glucose levels (4.78 ± 0.42) and understand daily glucose patterns (4.70 ± 0.47). The device also helped participants feel capable of managing their weight (4.52 ± 0.64). The nutrition coaching service was highly appreciated, particularly for its tailored approach (4.56 ± 0.51) and reliable materials (4.59 ± 0.57). Participants expressed satisfaction with the coach’s attitude and behavior (4.78 ± 0.42) and indicated a willingness to recommend the service to others (4.63 ± 0.56). Participants reported moderate improvements in dietary habits (4.37 ± 0.88) and other health behaviors, such as exercise and sleep (4.44 ± 0.75). Confidence in maintaining these lifestyle changes after the intervention was also noted (4.33 ± 0.83).

Satisfaction evaluation of flash-CGM and nutrition coaching services
DISCUSSION
This study evaluated the effects of a short-term multicomponent intervention, combining flash-CGM, structured nutrition education, and personalized nutrition coaching, on DSE and weight management among healthy university students. Significant improvements in DSE were observed, particularly regarding the ability to manage eating behaviors under emotional triggers such as stress, emotional instability and fatigue.
This finding is consistent with Shah et al. [14], who emphasized CGM’s ability to provide real-time insights into glucose trends, fostering awareness and motivating healthier dietary behaviors. Similarly, Clark et al. [21] highlighted self-efficacy as a critical component of successful weight management, reinforcing the role of tailored interventions in achieving meaningful behavioral change. The enhanced DSE observed in this study likely reflects the combined effect of flash-CGM feedback and supportive nutrition coaching, consistent with Kim et al. [2], who demonstrated the benefits of technology-assisted, personalized dietary coaching in young adults.
Although body weight could serve as a sensitive indicator for short-term change, BMI was used as the primary outcome to control for height variation across participants and ensure consistency with related literature. In this study, a modest but statistically significant reduction in BMI was noted across the total sample, although subgroup analysis revealed no significant change among participants with higher BMI (≥ 23 kg/m2). The observed BMI reduction, albeit small, indicates the potential utility of integrated digital health tools and personalized coaching in supporting weight management efforts. This outcome aligns with Klonoff et al. [16], who emphasized the potential of CGMs to drive behavioral modifications that support weight loss and prevent weight gain. The personalized dietary feedback provided during this intervention appears to have encouraged participants to make meaningful adjustments to their eating habits, resulting in measurable weight reductions.
It is noteworthy that significant improvements were also observed in participants’ NQ scores, particularly regarding fruit intake frequency and nutrition label checking habits, reinforcing the intervention’s effectiveness in promoting better dietary practices. Additionally, Kim et al. [2] demonstrated that personalized goal setting and smartphone-based nutrition counseling significantly improve both the NQ scores among young adults. These findings reinforce the effectiveness of combining technology with tailored guidance to achieve health-related goals.
While the behavioral improvements were clear, minimal changes were observed in glycemic markers, such as average glucose levels and estimated HbA1c, were derived from CGM data using the LibreView platform. This finding aligns with Shah et al. [14], who noted that glucose variability among healthy individuals is relatively low, making significant shifts in glycemic markers less likely within short intervention periods. The results underscore the importance of longer monitoring durations to fully capture the metabolic effects of CGM-based interventions. It is also worth noting that the primary focus of this study was on behavioral outcomes rather than metabolic changes, which may explain the limited findings in glycemic markers.
This study contributes to the growing body of evidence supporting the use of CGMs in non-diabetic populations. While prior research has predominantly focused on clinical populations, such as individuals with diabetes, this study highlights the broader applicability of CGMs for preventive health. The real-time feedback provided by CGMs offers a dynamic and engaging approach to dietary management, distinguishing it from traditional nutrition education programs. As Klonoff et al. [16] argued, CGMs represent a timely and relevant innovation for promoting metabolic awareness and supporting healthier lifestyle choices, even among individuals without diabetes.
Critically, Shmerling [15] raised concerns about CGM’s cost-effectiveness and necessity in non-diabetic populations, cautioning against its widespread adoption without clearer evidence of sustained benefits. This study addresses such skepticism by demonstrating CGM’s effectiveness in enhancing DSE and supporting weight management, particularly when combined with personalized coaching and nutrition education. However, future research should explore strategies to improve affordability and adherence. Until more evidence is available, CGM use in such populations should be considered exploratory and implemented in contexts where digital literacy and engagement are high.
Limitations
Despite these promising findings, this study has several limitations. A major limitation of this study is the multicomponent nature of the intervention. While CGM likely played a motivational role by providing real-time feedback, it was implemented alongside structured education and individualized coaching, both of which are known to influence dietary behaviors. Therefore, it is difficult to isolate the independent contributions of each component, notably flash-CGM use. This limitation should be clearly acknowledged, and future studies should include control groups or factorial designs to evaluate the separate contributions of each intervention component. Although the Foodlens app was used to track dietary intake, the data were not analyzed in detail in this study. Future studies should ensure thorough dietary data collection and analysis to clarify behavior change mechanisms. Additionally, the sample was relatively small and homogeneous, limiting generalizability. Larger-scale studies are needed to validate the observed effects across more diverse populations. It is essential to investigate the applicability of flash-CGM-based interventions in other populations, such as individuals with prediabetes, older adults, or those at higher risk of metabolic disorders.
The intervention period was limited to four weeks. While significant improvements in DSE and BMI were observed, the study cannot determine whether these changes are sustained over the long term. Future studies should incorporate follow-up periods to evaluate the persistence of the intervention’s effects. Also, the study relies heavily on self-reported data, which may introduce bias. Incorporating objective dietary assessments, such as digital food diaries or automated dietary tracking tools, could enhance the reliability of future studies. These limitations suggest that while flash-CGM interventions show promise, further research is necessary to confirm their broader applicability and long-term efficacy. However, our findings suggest that short-term flash-CGM use can be a powerful tool in promoting dietary awareness and self-efficacy. Real-time glucose monitoring appears to motivate individuals to adopt healthier eating habits by providing immediate feedback on dietary choices. While the study demonstrates the potential of flash-CGM in short-term interventions, the minimal changes in blood glucose and HbA1c levels indicate that longer-term monitoring may be necessary for significant metabolic improvements. It would also be valuable to examine the psychological mechanisms underpinning the observed improvements in DSE, as well as the role of flash-CGMs in maintaining long-term health behaviors. Qualitative studies capturing participants’ experiences and challenges with CGM use could provide further insights into how these devices can be optimized for broader adoption. Addressing these concerns, this study demonstrates that CGMs can effectively enhance DSE and weight management when combined with personalized coaching. However, future research should explore strategies to optimize cost-efficiency and assess whether these benefits can be sustained over longer periods.
Conclusion
In conclusion, this study suggests that a multicomponent intervention utilizing flash-CGM, nutrition education, and personalized coaching can effectively enhance DSE and support modest weight reduction among university students. While these findings are promising, the inability to isolate the effect of CGM alone, the absence of detailed dietary intake analysis, and the short intervention period should be addressed in future research. By expanding on these initial results and addressing the identified limitations, future work can further validate the role of CGMs as an innovative tool for preventive health.
Notes
CONFLICT OF INTEREST
There are no financial or other issues that might lead to conflict of interest.
FUNDING
This research was supported by a grant from 2024 Semyung University.
DATA AVAILABILITY
The participants of this study did not give written consent for their data to be shared publicly. Due to the sensitive nature of the research, supporting data is not available.
ACKNOWLEDGMENTS
This research was supported by the Semyung University Research Grant of 2024. We would like to express our sincere gratitude to Jieun Park for her valuable assistance with the statistical analysis.