Healthy eating intentions among adults in China: a cross-sectional study of northern and southern regions and city tiers based on the theory of planned behavior
Article information

Abstract
Objectives
The theory of planned behavior (TPB) has been widely employed to predict healthy eating intentions. Regional differences may affect dietary habits, health status, and personality traits, whereas variations in urbanization influence accessibility to fresh and healthy food, thereby impacting TPB components. This study aimed to explore whether regional differences between northern and southern China including city-tier development are associated with healthy eating intentions among Chinese adults.
Methods
The study included data from 2,114 Chinese adults aged 19–64 years collected between 2019 and 2023. Participants were categorized by geographic region (north or south) and city-tier status (first-tier or other).
Results
Compared to individuals from northern first-tier cities, those from southern regions exhibited stronger attitudes, perceived behavioral control (PBC), and intention to eat healthily. Participants from other cities in the north had more positive attitudes, subjective norms, PBC, and intentions to participate in healthy eating. Furthermore, residents of southern cities revealed weaker subjective norms than those of cities in the north. The adjusted odds ratio (OR) for compliance with intention to engage in healthy eating was higher among participants from other cities in both the north and south compared to those from northern first-tier cities (northern other cities: OR = 2.43, 95% confidence interval [CI]: 1.49–3.97, P < 0.001; southern other cities: OR = 1.95, 95% CI: 1.08–3.51, P = 0.027). No significant differences existed among the subjects from first-tier cities according to their geographic regions. These trends remained consistent even after including the interaction term between geographic regions and city-tier classification.
Conclusion
These findings underscore the complexity of regional variations influencing dietary intentions and indicate that tailored health promotion strategies should incorporate regional characteristics. Future research should explore underlying factors, including regional cultural influences, to better inform policies and interventions.
INTRODUCTION
The theory of planned behavior (TPB) [1] is widely employed to explore how attitude, subjective norms, and perceived behavioral control (PBC) influence behavioral intentions, particularly health-related decisions in adults [2-7]. Stronger intentions are associated with a higher likelihood of performing a particular behavior [1]. Attitude reflects the positive or negative evaluation of a behavior, subjective norms involve social pressure and willingness to comply with others’ expectations, and PBC refers to the perceived ease or difficulty in executing a behavior [1]. PBC also directly influences behavior when factors are beyond individual control, especially when actions are not entirely voluntary [1]. As healthy eating is challenging and not fully controllable, PBC plays a crucial role [1]. The intention to practice healthy eating is strongly associated with the probability of engaging in certain behavior [2-7].
Healthy eating behaviors are influenced by dietary environment, as emphasized by Brug [8]. Among Chinese adults, healthy eating intentions have previously been studied using TPB because it is believed to predict intentions for rationally determined behavior, with findings consistent across multiple studies in multiple locations in China [9-11]. However, the unique characteristics of China, such as its regional living conditions, necessitate further examination, to data, no previous study has directly examined the healthy eating intentions of Chinese adults in different regions. China’s vast geography, characterized by distinct northern and southern regions, contributes to variations in eating habits, health conditions, and cultural practices. Previous research has often overlooked comparative analyses of these regional differences, either underscoring solely on individual regions or lacking direct comparisons between regions [12-14].
Some regional studies, such as those conducted in Guanzhong (Shanxi) and southeastern Guizhou, have revealed the significant impact of geographic differences on food culture, highlighting the importance of addressing the interplay between human behavior and geographic environments to foster a healthier and more harmonious dietary culture [15]. Furthermore, regional disparities, including prevalence of diseases such as dementia, have been linked to differences in dietary patterns, potentially reflecting the broader influence of regional variations on healthy eating [16]. Historical differences between the northern and southern regions have also shaped distinct dietary preferences and health outcomes, affecting intentions towards healthy eating among Chinese adults [17].
In addition to geographic variations, urbanization influences access to healthy foods and perceptions of healthy eating [18, 19]. Consequently, regional decision-making disparities can affect healthy eating habits substantially. Thus, effective nutritional interventions require careful consideration of regional contexts in alignment with China’s 2030 Health Plan [20].
Geographically, the Qinling-Huaihe Line has historically served as a natural boundary dividing northern and southern China, primarily based on climatic differences that have significantly shaped agricultural practices and dietary habits. These dietary differences influence individual variations in healthy eating intentions, which in turn impact the feasibility of adopting healthy eating plans. For instance, understanding the healthy eating intentions of northern adults accustomed to a red meat-based diet is crucial [21].
Moreover, city-tier classifications in China, which reflect urban development levels, city size, and population density, play a central role in shaping dietary accessibility and preferences. First-tier cities, such as Beijing, Shanghai, and Guangzhou, differ markedly from lower-tier cities in terms of resources and infrastructure, which can significantly influence healthy eating intentions. Examining how these urban development factors intersect with regional dietary differences offers valuable insights for promoting healthier eating intentions among Chinese adults [22-24]. Hence, this study examined how the combined factors of regional (north-south) and urban development (city tier) differ in terms of healthy eating intentions.
METHODS
Ethics statement
This study was approved by the Institutional Review Board of Sangmyung University between 2019 and 2023 (BE2019-01-05, SMUIRBC-2020-009, and SMUIRBC-2023-001).
1. Study design
This cross-sectional study was designed in accordance with the Strengthening the Reporting of Observational Studies in Epidemiology (STROBE) guidelines (https://www.strobe-statement.org/).
2. Theoretical concepts
This study was based on Ajzen’s [1] TPB, which includes attitudes, subjective norms, PBC, and intentions towards healthy eating. To explore potential regional differences in the relationships among these TPB constructs, two regional characteristics—the geographic distinction between north and south and city-tier classification (first-tier cities vs. other cities) were examined.
3. Study participants and data collection period
This study integrated data collected from numerous regions across China, including Anhui, Henan, Heilongjiang, Beijing, and Shanghai, using the sampling methodologies described in previous studies [9-11]. These regions were carefully selected to facilitate a comprehensive analysis of regional (north-south) and urban development (city-tier) differences in healthy eating intentions. By including both northern and southern regions, including first-tier and other cities, this study aimed to capture diverse dietary practices and their potential influence on healthy eating intentions (Fig. 1) [25]. Furthermore, the geographical locations of these regions were relatively aligned, improving the study’s ability to compare findings across different contexts.
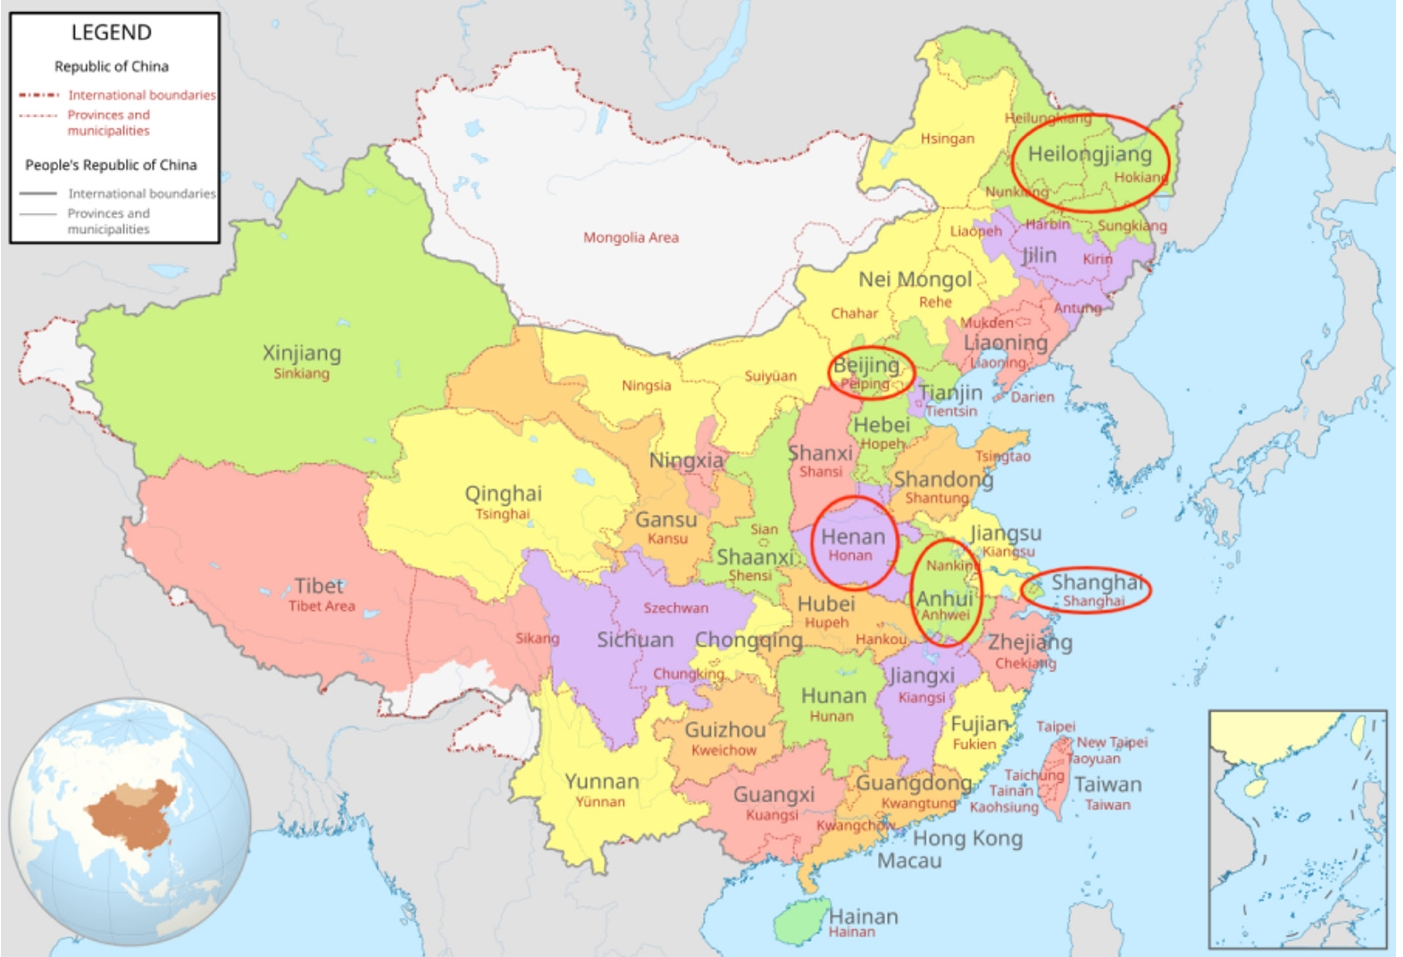
Study locations in China. Modified from Wikipedia [Internet]. Wikipedia; 2009 [cited 2025 Mar 24] (https://upload.wikimedia.org/wikipedia/commons/thumb/9/98/ROC_vs_PRC.svg/1280px-ROC_vs_PRC.svg.png) [25].
Anhui and Henan were selected to represent cities outside the first-tier category. As of 2024, Henan comprises 17 prefecture-level cities with a population of approximately 98.15 million and a per capita disposable income of 31,552 Chinese Yuan (CNY), while Anhui consists of 16 prefecture-level cities with a population of about 61.23 million and a per capita disposable income of around 36,800 CNY. Both provinces are predominantly inhabited by Han ethnic groups. Geographically, Henan is located between 31°23′–36°22′ north latitude and 110°21′–116°39′ east longitude, while Anhui is situated between 29°41′–34°38′ north latitude and 114°54′–119°37′ east longitude. Although both provinces are situated near the central region of China, Henan is positioned relatively more to the north and Anhui is more to the south. Including these two provinces allowed us to capture regional dietary differences between the north and south, excluding the influence of major metropolitan areas [26, 27].
Beijing and Shanghai were selected as first-tier cities in northern and southern China, respectively. As of 2024, Beijing’s permanent population will be approximately 21.832 million, with a per capita disposable income of approximately 85,415 CNY. Shanghai’s permanent population is approximately 24.7589 million, with a per capita disposable income of approximately 84,834 CNY. Both cities are predominantly inhabited by Han ethnic groups. Geographically, Beijing is located between 39°28′–41°05′ north latitude and 115°20′–117°30′ east longitude, while Shanghai is situated between 30°42′–31°48′ north latitude and 120°52′–122°16′ east longitude. The inclusion of these internationally recognized metropolises allows us to explore how city-tier status influences healthy eating intentions [28, 29].
Because most of the samples were concentrated in areas closer to the south, data from Heilongjiang were integrated to address potential gaps and enhance the study’s comparison between the northern and southern regions. As of 2024, Heilongjiang’s permanent population is approximately 21.832 million, with a per capita disposable income of approximately 31,269 CNY. The population is predominantly Han, and its geographical location spans 43°26′–53°33′ north latitude and 121°11′–135°05′ east longitude [30]. Heilongjiang broadened the geographical scope of this study and strengthened the comparative analysis of the regional differences.
Given the vastness and diversity of China, which is comprised of 34 provinces, municipalities, and autonomous regions, it is unrealistic to collect responses from adults nationwide. Furthermore, aside from Liu et al. [9], Liu et al. [10], and Ma et al. [11], no studies have directly focused on healthy eating intentions of Chinese adults. Therefore, we strategically organized the data based on the regional selection outlined above, which included Beijing, Shanghai, Henan, Anhui, and Heilongjiang. This approach allows for a comprehensive analysis of both north-south regional differences and city-tier distinctions, with Beijing and Shanghai representing first-tier cities and Henan, Anhui, and Heilongjiang representing “other cities.” This regional sampling framework was designed to provide a balanced and meaningful comparison of healthy eating intentions across diverse geographical and urban developmental contexts. Data were collected using online questionnaires distributed by five investigators between 2019 and 2023, resulting in 2,232 completed responses. A total of 118 responses were excluded because of lack of consent (n = 10), insufficient response time (< 4 minutes; n = 9), age criteria violations (< 18 or > 64 years; n = 88), missing data (n = 9), and data errors (n = 2). Consequently, 2,114 valid responses were included in the final analyses [31, 32]. Although an a priori power analysis was not conducted, the sample size of 2,114 participants was considered sufficient to yield statistically significant results given the sample sizes used in previous studies and the analytical design of the current study.
4. Study measures
1) General characteristics
The demographic variables collected included sex, age (years), marital status (married or unmarried), alcohol consumption (categorized as never, < once/week, ≥ once/week, everyday), lifetime smoking status (never or ever), presence of disease, cohabitation with family, employment status, education level (≤ high school, ≥ college), monthly income (< 5,000 CNY, > 5,000 CNY), and physical activity level (low, moderate, active). Moreover, the participants were classified based on geographic region (north or south) and city-tier status (first-tier or other cities).
2) TPB constructs
The survey instrument evaluated the constructs of the TPB, including attitudes, subjective norms, PBC, and intentions towards healthy eating. In previous studies, detailed descriptions of these measurement items and their reliabilities have been documented [9-11]. All constructs were evaluated using a 5-point Likert scale, with Cronbach’s alpha coefficients exceeding 0.7, indicating good reliability.
Attitudes towards healthy eating were evaluated using six evaluative adjectives: harmful/beneficial, useful/useless, good/bad, pleasant/unpleasant, boring/interesting, and desirable/undesirable. Subjective norms were measured by asking respondents to rate their perceptions of social pressure to eat healthily from numerous sources, including family, friends, classmates, colleagues, experts (e.g., doctors and nutritionists), government authorities, TV programs, newspapers, and internet information (e.g., blogs and YouTube). PBC was evaluated through four questions rated from “definitely yes” to “definitely no.” These questions assessed the respondents’ confidence in their ability to eat healthily, including: “Will you try to eat healthily?”, “Do you have enough self-discipline to eat healthy?”, “Do you have enough time to eat healthy?”, and “Do you want to eat healthy regardless of any difficulties you encounter?” Behavioral intentions regarding healthy eating were measured through four statements rated from “definitely yes” to “definitely no.” These statements included: “In the next two weeks, I am willing to eat healthy meals,” “Eat a healthy meal,” “Have plans to eat healthy food,” and “Want to recommend healthy food to my family, friends, and colleagues.”
5. Statistical analysis
Categorical variables were compared using the chi-squared test, while continuous variables were presented as means ± standard deviations and analyzed using independent-sample t-tests. These analyses were conducted according to the geographical region and city-tier classification. Multiple linear regression analyses were conducted to examine the differences in the scores of each TPB construct according to regional factors. Owing to significant differences in demographic characteristics across regions, the analyses were adjusted for potential confounding factors, including sex, age, alcohol consumption, lifetime smoking, presence of disease, cohabitation with family, employment status, education level, monthly income, and physical activity level. Furthermore, multiple logistic regression analyses were employed to identify regional differences, with the results expressed as odds ratios (ORs) and 95% confidence intervals (CIs) for the TPB constructs. In the binary logistic regression model, each TPB construct was recoded as “compliance” if the average score on the 5-point scale was 4 or higher and as “noncompliance” if it was below 4. The number of respondents classified as noncompliant for each construct was as follows: attitude (n = 585), subjective norm (n = 798), PBC (n = 869), and intention (n = 835). The analysis process consisted of three steps: (1) Predicting each TPB construct as a dependent variable while controlling for confounders. (2) The intention to engage in healthy eating was examined as a dependent variable, using the three TPB constructs (attitude, subjective norm, and PBC) as independent variables, along with confounders. (3) The interaction between geographical region and city-tier classification was added to the second model to assess its potential effects. Data analysis was conducted using SPSS software version 26 (IBM Corp.). Statistical significance was set at P < 0.05.
RESULTS
1. General characteristics of participants by geographic region and city-tier classification
Participants from northern regions were more likely to be male (P < 0.001), more adults aged 18–25 (P < 0.001), more than 15.3% of people tried drinking alcohol (P < 0.001), nonsmokers (P = 0.018), less educated (P = 0.010), and had lower income levels (P = 0.001) than those from southern regions. Conversely, participants residing in first-tier cities were more likely to be female (P = 0.044), young adults under 40 years old (P < 0.001), have tried alcohol consumption (approximately 60%; P < 0.001), have a diagnosed disease (P = 0.001), live with family (P < 0.001), be employed (P < 0.001), have higher education levels (P = 0.010), have higher income levels (P < 0.001), and engage in more physical activity (P < 0.001) compared to those living in other cities (Table 1).

General characteristics of participants by geographic region and city-tier classification
2. Comparison of TPB constructs by geographic region and city-tier classification
Compared to participants from the southern region, those from the northern region had higher scores for subjective norms (t = 3.69, P < 0.001), PBC (t = 2.09, P = 0.037) and intention to engage in healthy eating (t = 2.57, P = 0.010). Participants residing in first-tier cities had lower scores across all TPB constructs (all P < 0.001). When further classified by geographic region, participants from northern first-tier cities had lower scores for attitude (t = –3.76, P < 0.001), PBC (t = –2.22, P = 0.027), and intention to engage in healthy eating (t = –2.12, P = 0.034) compared to those from southern first-tier cities. Among participants living in other cities, those from the northern regions had lower scores for attitude (t = –3.79, P < 0.001) and higher scores for subjective norms (t = 3.32, P = 0.001) and PBC (t = 4.25, P < 0.001) than their southern counterparts. Furthermore, when participants were analyzed based on city-tier within each geographic region, those from northern first-tier cities had significantly lower scores for attitude (t = –6.60, P < 0.001), subjective norms (t = –5.28, P < 0.001), PBC (t = –5.73, P < 0.001), and intention to engage in healthy eating (t = –5.65, P < 0.001) compared to those from northern other cities. However, no significant differences were observed between participants living in the first tier and those living in other cities in the southern region (Table 2).

Comparison of theory of planned behavior constructs by geographic region and city-tier classification
3. Relationships among TPB constructs by geographic region and city-tier classification
Multiple linear regression analyses were conducted after adjusting for potential confounders, including sex, age, alcohol consumption, lifetime smoking, presence of disease, living with family, employment status, education level, monthly income, and physical activity. The results indicated that participants from the northern region had significantly higher scores for subjective norms (t = 3.74, P < 0.001), PBC (t = 2.09, P = 0.037), and intention to engage in healthy eating (t = 2.57, P = 0.010) than those from the southern region. Conversely, participants residing in first-tier cities scored significantly lower across all TPB constructs (attitude, subjective norms, PBC, and intention) than those living in other cities (all t > 6, all P < 0.001). Further analyses of the city-tier classification within each geographic region demonstrated different patterns. Among participants from the northern regions, those residing in first-tier cities exhibited significantly lower scores for attitude, subjective norms, PBC, and intention to engage in healthy eating than those living in other cities (all t > 6, all P < 0.001). Conversely, among participants from the southern regions, no significant differences were observed across the TPB constructs based on city-tier classification (Table 3).

Linear regression results of the relationships among theory of planned behavior constructs by geographic region and city-tier classification
4. OR (95% CI) for compliance with TPB constructs by geographic region and city-tier classification
First, compliance with each TPB construct was examined by geographic region and city-tier classification. Compared to individuals from northern first-tier cities, those residing in northern other cities exhibited significantly stronger attitudes (OR = 3.57, 95% CI: 2.62–4.86, P < 0.001), subjective norms (OR = 2.33, 95% CI: 1.73–3.14, P < 0.001), PBC (OR = 2.58, 95% CI: 1.91–3.48, P < 0.001), and intentions to engage in healthy eating (OR = 3.04, 95% CI: 2.25–4.12, P < 0.001). Moreover, individuals from southern first-tier cities revealed higher values for all constructs except subjective norms, compared to those from northern first-tier cities (attitudes, OR = 2.08, 95% CI: 1.48–2.92, P < 0.001; PBC, OR = 1.48, 95% CI: 1.06–2.07, P = 0.020; intention, OR = 1.52, 95% CI: 1.09–2.12, P = 0.014). Similarly, participants from other southern cities showed significantly stronger attitudes (OR = 6.06, 95% CI: 3.94–9.31, P < 0.001), PBC (OR = 1.98, 95% CI: 1.37–2.86, P < 0.001), and intentions to engage in healthy eating (OR = 2.23, 95% CI: 1.54–3.23, P < 0.001). Second, compliance with the intention to engage in healthy eating, including all three TPB constructs, was examined by geographic region and city tier. No significant differences existed among the subjects from first-tier cities according to their geographic regions. However, compared to northern first-tier cities, participants from other cities in both the north and south displayed stronger intentions (northern other cities: OR = 2.43, 95% CI: 1.49–3.97, P < 0.001; southern other cities: OR = 1.95, 95% CI: 1.08–3.51, P = 0.027). In the model, all three TPB constructs remarkably predicted intention: attitude (OR = 1.09, 95% CI: 0.79–1.50, P = 0.603), subjective norm (OR = 2.11, 95% CI: 1.51–2.96, P < 0.001), and PBC (OR = 41.56, 95% CI: 27.65–62.46, P < 0.001) (data not shown). Finally, additional analysis testing the interaction between geographical region and city-tier classification revealed no significant effect (P = 0.422), whereas geographic region (P = 0.017) and city-tier classification (P = 0.044) remained significant (data not shown) (Table 4).

Odds ratios (95% confidence intervals) for compliance with theory of planned behavior constructs by geographic region and city-tier classification (ref = first-tier in north)
DISCUSSION
The TPB has been widely used to study individuals’ intentions towards healthy eating [7]. It has been employed to diverse demographic groups including adolescents [2], pregnant women [33], and individuals with varying weight statuses such as normal weight, overweight, and obese [34]. These studies were conducted in numerous countries, including the United States and New Zealand. Given the strong predictive power of the TPB for healthy eating behavior, this study applied it to Chinese adults across different regions, addressing a gap in prior research that did not account for regional variations in China.
This study revealed significant regional differences in healthy eating intentions among Chinese adults. This study found notable differences in TPB constructs between individuals in the first-tier and those in other cities, including between the northern and southern regions, after accounting for confounding factors. These differences may be influenced by the regional food culture, economic development, and historical factors [35]. The results indicate that healthy eating intentions vary depending on geographic and urban classifications. When each TPB factor was separately analyzed, participants residing in other cities generally reported higher scores across all constructs. However, when intention was explored as the dependent variable with all three TPB constructs (attitude, subjective norm, and PBC) included as predictors, no significant difference in healthy eating intentions was noted within first-tier cities, regardless of geographical region. Notably, all three constructs significantly predicted intention. This finding may be explained by an increased preference for convenience foods during the coronavirus disease 2019 (COVID-19) pandemic [36]. During the pandemic, individuals attempted to maintain healthier and more regular diets as a coping mechanism. However, after the pandemic, their focus shifted towards other activities, resulting in greater reliance on convenience foods. Moreover, the resumption of local social activities after prolonged restrictions may have contributed to “revenge consumption” [37]. During social gatherings, people are more likely to select less healthy foods, which may partially explain the negative correlation observed between TPB constructs and the intention to engage in healthy eating. This finding may be attributed to an increased preference for convenience foods during COVID-19 pandemic [36]. People have attempted to adopt healthier and more regular diets as a coping mechanism during the pandemic. However, after the pandemic, their focus shifted towards other activities, leading to greater reliance on convenience foods. Additionally, the resumption of local social activities after prolonged restrictions may have contributed to “revenge consumption” [37]. During social gatherings, individuals are more likely to choose less healthy foods, which may partially explain the observed negative correlation.
Importantly, the samples integrated in this study were collected during this transitional period [38, 39]. Geographical variation may explain some of these findings. For instance, while Henan Province and Heilongjiang Province are both in northern China, their latitudinal differences are substantial (Henan: 31°23'N–36°22'N; Heilongjiang: 43°26'N–53°33'N). Conversely, Anhui Province and Shanghai, both classified as southern regions in this study, have minimal latitudinal differences (Anhui: 29°41'N–34°38'N; Shanghai: 30°40'N–31°53'N). These geographical similarities may contribute to the lack of significant differences between southern first-tier cities and other southern cities, as regions with similar food cultures and health conditions tend to exhibit comparable dietary behaviors.
Building upon prior research, this study underscored on regional differentiation, recognizing that eating habits vary significantly across China [40]. Previous findings indicated that “freshness” plays a crucial role in food choices, potentially linked to regional differences. Freshness also reflects the accessibility to fresh food and is closely related to PBC. This study introduces urban development as a key factor as infrastructure and economic development significantly impact access to healthy food options. These findings indicate that demographic characteristics vary across regions, raising the question of whether these variations indirectly influence healthy eating intentions [41]. Despite incorporating regional variations, the TPB remains a robust framework for predicting healthy eating intentions among Chinese adults [9-11]. Previous studies have emphasized that PBC is a strong determinant of behavioral intentions, indicating that promoting knowledge, ability, and self-efficacy can enhance decision-making regarding healthy diets [42]. Moreover, previous research by other scholars examined only a single region from the four regions included in this study. For example, Ma et al. [11] focused on Heilongjiang, Liu et al. [9] on Beijing, and Liu et al. [10] on Shanghai and Anhui. Findings from the Heilongjiang and Beijing studies indicate that both subjective norms and PBC significantly influence short-term healthy eating intentions. However, the significant effect of subjective norms disappeared in Shanghai and Anhui. This discrepancy indicates that regional differences moderate the influence of TPB constructs on healthy eating intentions.
Therefore, implementing uniform nutrition intervention policies across different regions may not yield optimal results owing to variations in regional food culture, health concerns, and personality traits [17]. Research on dementia prevalence suggests that regional disparities in China may be linked to dietary patterns [16]. This study highlighted the need to consider regional differences from a broader perspective. These variations ultimately affect the effectiveness of dietary policies, necessitating a more nuanced approach to decision-making. Research in Europe has demonstrated the effectiveness of targeted policy interventions, such as advertising regulations, which reduced fast-food purchases by 7.1%–9.3% in Quebec in 1980 [43].
The strength of this study lies in its detailed analysis of regional differentiation, incorporating both geographic and urban development factors that influence TPB constructs and ultimately affect healthy eating intentions. The literature suggests that dietary habits vary significantly across China, with certain regions (e.g., southern and coastal areas) favoring healthier diets characterized by reduced red meat consumption and a higher intake of fiber-rich foods [21]. Differences in subjective norms and PBC further complicate the effectiveness of nutritional intervention policies across regions.
Beyond differences in geographic and urban development, variations in regional agriculture may shape local food culture and dietary preferences [44, 45]. For example, the famous “Huaiyang cuisine,” one of China’s four major culinary traditions, originated in Yangzhou City, Jiangsu Province, and spans Jiangsu, Anhui, Shanghai, and other regions [46]. However, this culinary tradition does not extend to areas such as Henan, Beijing, and Heilongjiang, which may partly explain why Shanghai, as a first-tier city, exhibits analysis results that are more similar to Anhui than to the northern regions. Additionally, first-tier cities were among the first to develop and perfect the takeout industry, rendering it easier for residents to access convenient but less healthy food options [47]. This factor may explain why scores from other cities generally exceed those of first-tier cities and why the TPB structure in first-tier cities shows similar predictions of intention. Considering that diet is a fundamental aspect of culture, exploring its role in shaping regional dietary norms could provide valuable insights into the development of more effective nutritional policies.
Limitations
A key limitation of this study is the imbalance in the sample distribution, particularly between the northern and southern regions and between male and female participants. To minimize their impact on the research results, sex, age, and other demographic factors were included as confounding variables in the analysis and adjusted accordingly. However, future research should aim for a more balanced sample to improve accuracy and generalizability. Interestingly, no significant differences were observed in the TPB constructs among adults in the southern regions, first-tier cities, and other cities. This finding indicates that cultural and historical factors may play an essential role in shaping regional dietary behavior, which warrants further exploration. When implementing nutritional policies in China, policymakers should consider regional factors when developing effective strategies tailored to different populations. A regionally sensitive approach may yield more reliable and impactful results, ensuring that health interventions align with the needs and preferences of diverse communities. Future studies should explore how regional differences influence healthy eating intentions among Chinese adults. Identifying the underlying causes of these differences is essential because relying solely on geography and urban development is insufficient to inform government policies. Effective decision-making requires comprehensive research to ensure accurate insights.
Conclusion
This study explored regional differences in healthy eating intentions among Chinese adults using TPB. These findings suggest that a uniform nutritional policy may not be effective across China owing to regional variations in food culture, economic development, and accessibility to fresh food. Future policies should consider these differences to create targeted and effective interventions.
Notes
CONFLICT OF INTEREST
There are no financial or other issues that might lead to conflict of interest.
FUNDING
This research was funded by National Research Foundation of Korea grants from the Korean government (MSIT) (NRF-2020R1A2C1011675 and RS-2023-00280503).
DATA AVAILABILITY
Research data is available from the corresponding author upon request.